
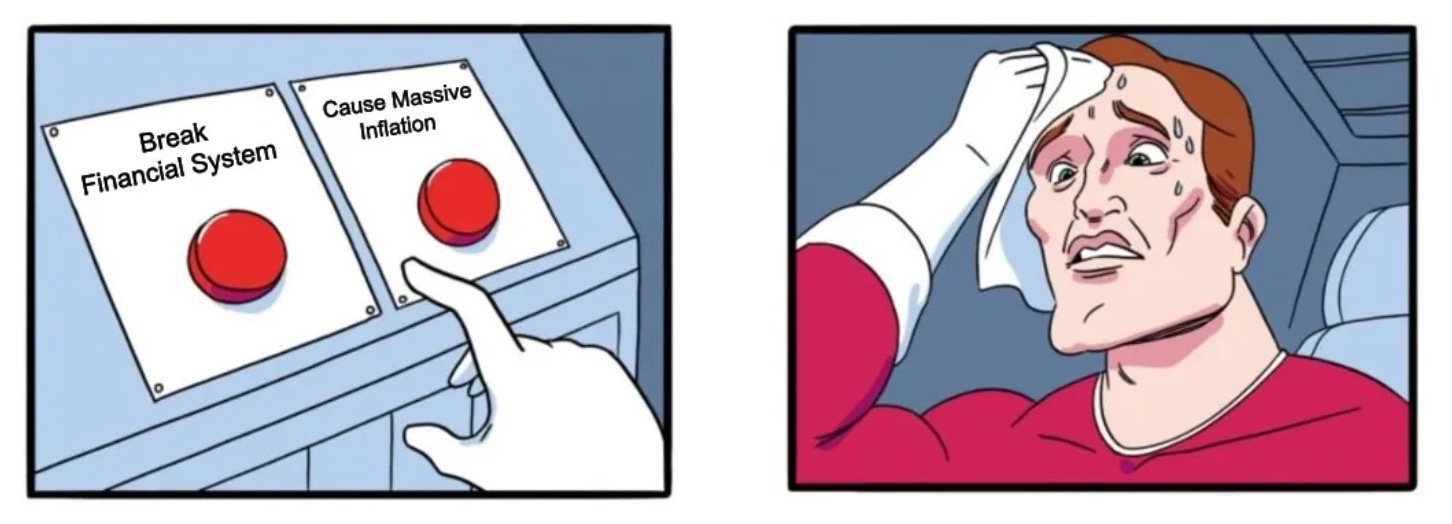
💡Why QT is Dead and QE is Coming
Issue 188

✌️ Welcome to the latest issue of The Informationist, the newsletter that makes you smarter in just a few minutes each week.
🙌 The Informationist takes one current event or complicated concept and simplifies it for you in bullet points and easy to understand text.
🫶 If this email was forwarded to you, then you have awesome friends, click below to join!
👉 And you can always check out the archives to read more of The Informationist.
Today’s Bullets:
Liquidity Crisis On The Horizon
The SOFR Spread is Widening
September 2019 Repo Revival?
Why the Fed is Terrified
The Money Printer Pivot Plan
Inspirational Tweet:

One line uttered from Fed Chairman Jerome Powell has the markets buzzing with speculation this last week.
“The Fed may stop shrinking its balance sheet in the months ahead.”
Translated: “QT is about to become QE, and it’ll happen faster than most people expect.”
But is this just a symbolic move, or is it more significant than that? And most importantly, what is Powell signaling about the current state of the financial system?
If all this talk about monetary policy has your own head buzzing with confusion, have no fear. Because we are going to unpack all of it for you, nice and easy as always, here today.
So, grab a big, hot cup of coffee, and settle into a comfortable seat for a deep peek in to the Fed’s Liquidity Playbook with this Sunday’s Informationist.
Partner spot

Is the fiat retirement system sinking? With markets uncertain, layoffs on the rise, and monetary policy shifting, it might be time to rethink how you protect your long-term savings.
On October 28 at 12 PM CT, Mark Moss and Unchained’s Jeff Vandrew will cover:
Why the “illusion of wealth” hides the true weakness of fiat-based retirement accounts
Why bitcoin’s scarcity and growth curve make it the cheat code for retirement planning
How rolling an old 401(k) into a bitcoin IRA could offer tax advantages and help build generational wealth
Learn how bitcoin can protect your purchasing power, strengthen your retirement plan, and offer a level of sovereignty no other retirement asset can.
WHEN: Tuesday, Oct 28 at 12:00 PM CT — online, free to attend.
😬 Liquidity Crisis On The Horizon
Some of you may recall that back in January, I wrote about the Fed’s liquidity problem and how we were approaching critical thresholds that would force a policy shift.
That article is here, if you want a refresh, but it is not necessary:

and another here:

To summarize, it seems we recently crossed the Rubicon—in a number of ways.
Let me explain, and get comfortable, because there’s a whole lot to unpack here, and this letter is a bit longer than usual.
But don’t worry, we’ll dive right into the good stuff, and we’ll keep it simple for you. Let’s get right to it, though.
First issue.
The Reverse Repo Facility Is Now Toast
You know, that giant piggy bank of excess liquidity that I’ve spoken about numerous times before, the one that peaked at about $2.4 trillion in 2022—is now essentially empty.
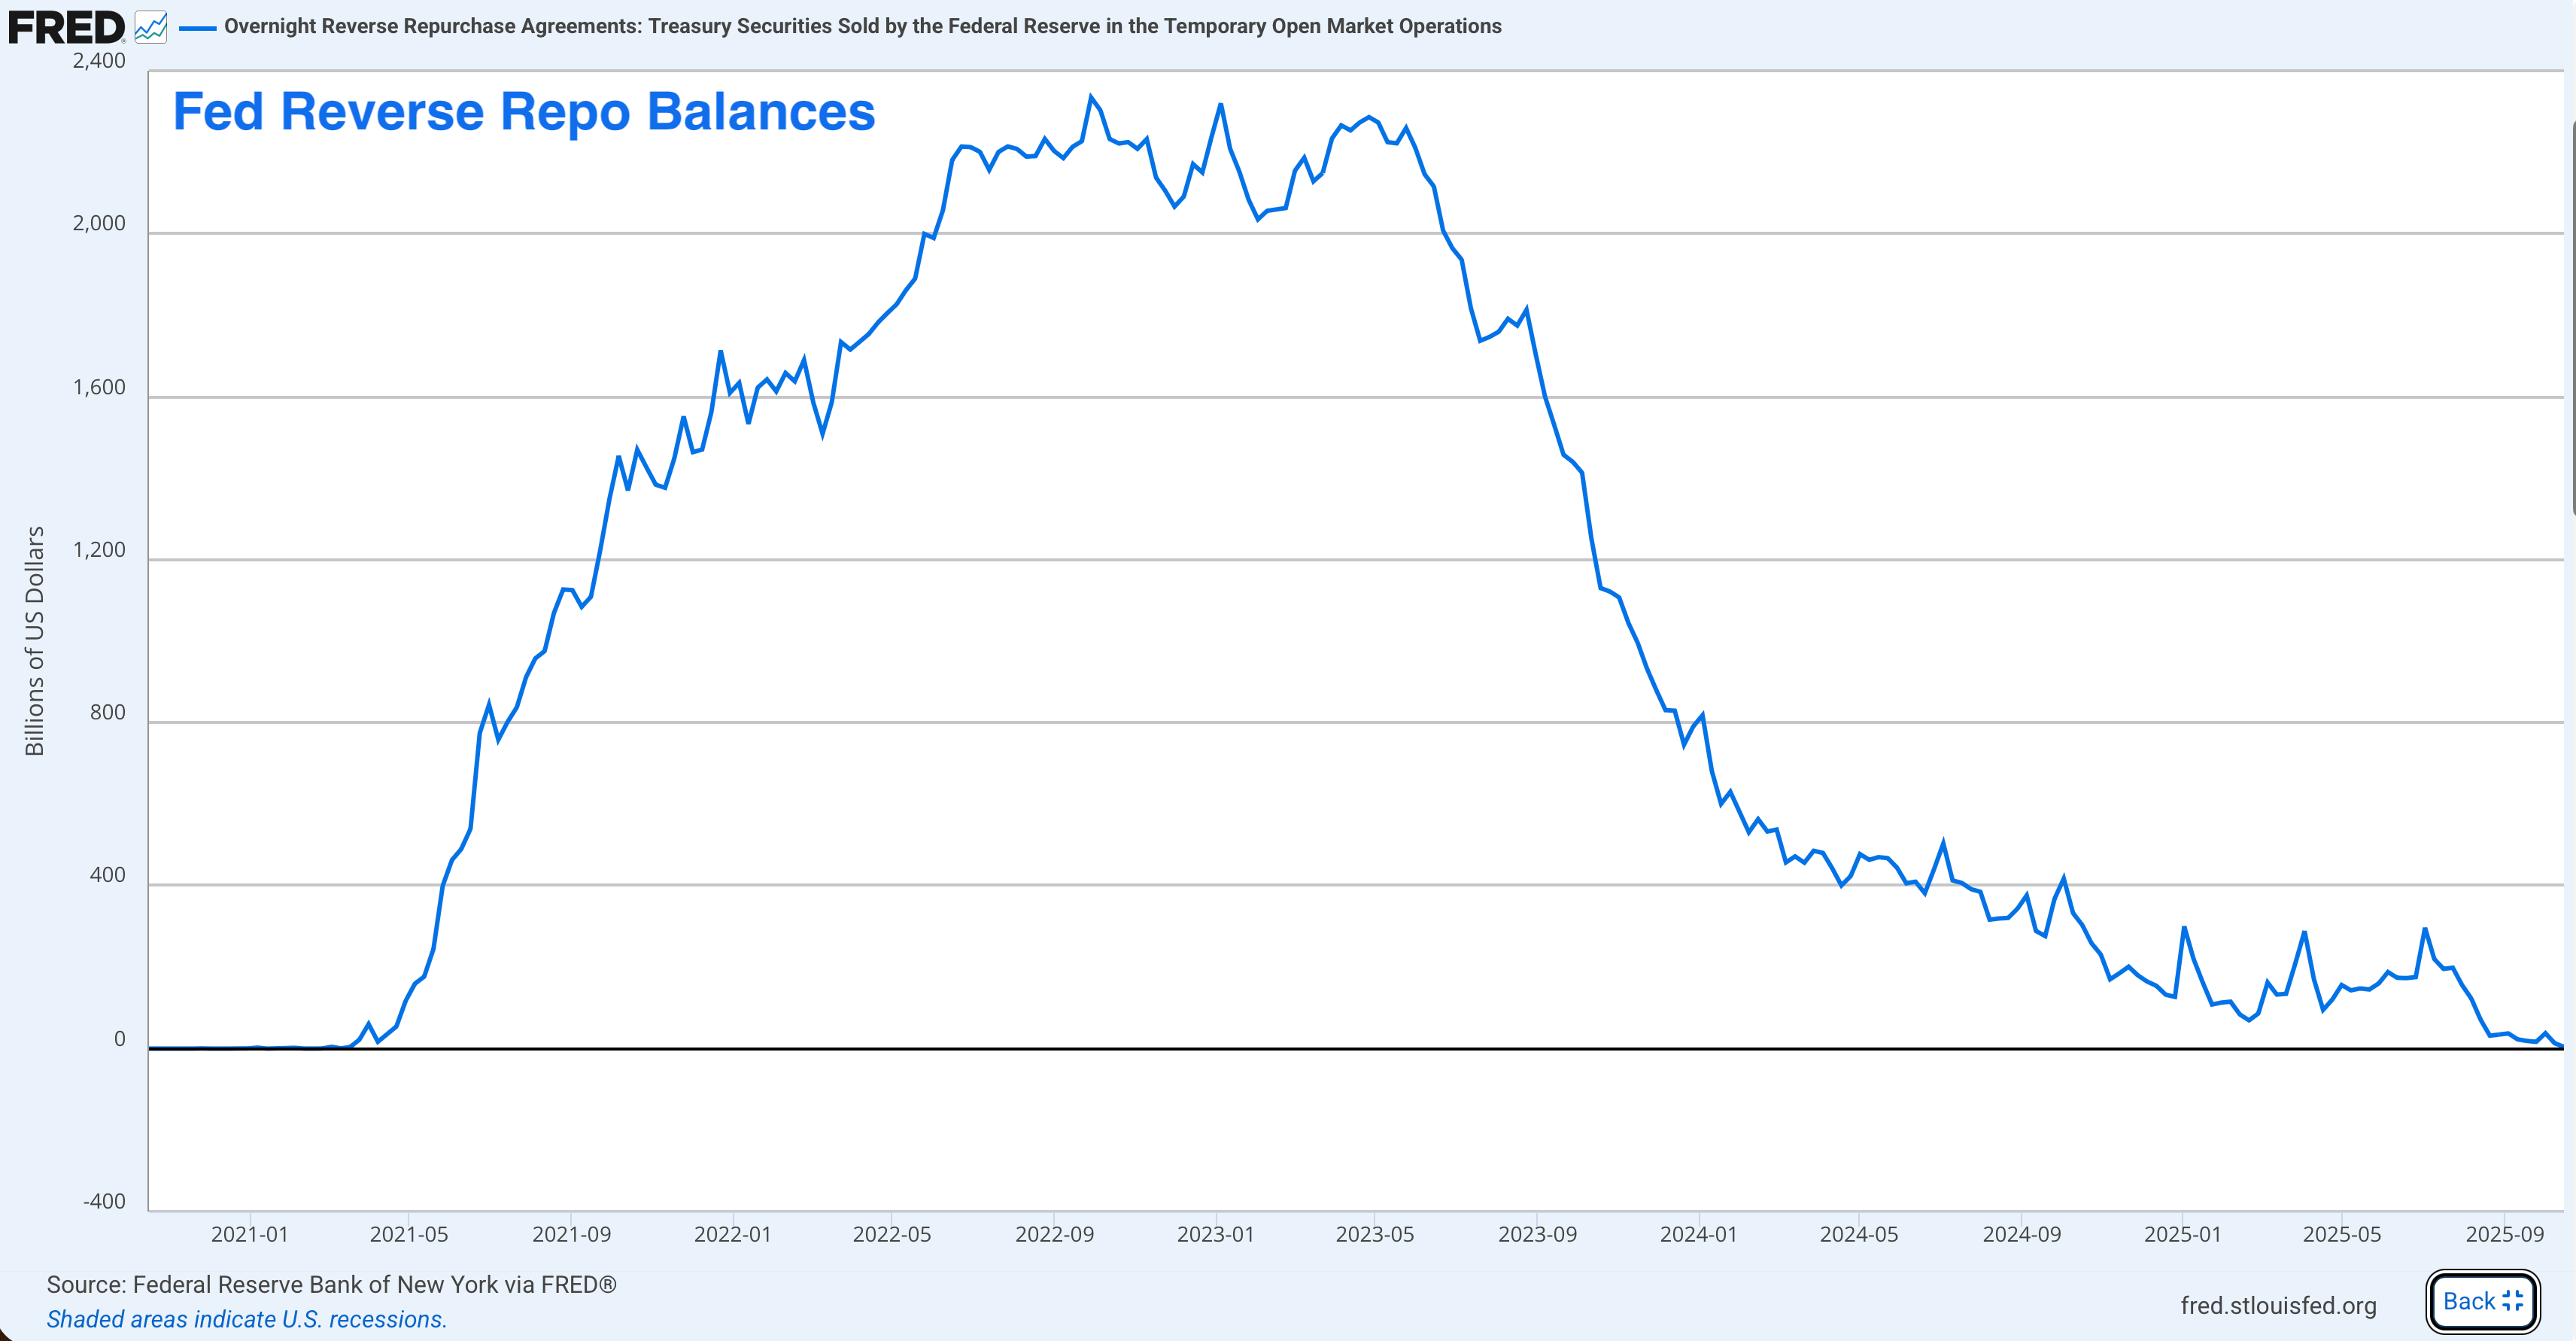
As of this week, the RRP sits at just a few billion dollars. That’s a rounding error in Fed-terms.
And it’s a drawdown of more than 99% from the peak.
Problem is, the RRP isn’t just some obscure Fed facility—it’s been the shock absorber for the entire financial system over the last few years.
Remember, the RRP was created as a tool to help the Fed manage short-term interest rates, before it became something much more important: a release valve for excess liquidity.
See, during the Covid clown car money-printing bonanza, the Fed and Treasury flooded the system with trillions of dollars. And where did a lot of that cash end up? Parked in the RRP through money market funds.
Then Treasury Secretary Janet Yellen got clever. She figured out she could drain this facility by issuing attractive short-term T-Bills.
How?
Money market funds would pull their cash out of the RRP (earning the Fed’s RRP rate) to buy higher-yielding T-Bills instead. This allowed the Treasury to fund the government’s massive deficits without flooding the market with long-term US Treasury bonds.
Brilliant strategy. Until the RRP slush fund is drained, that is.
And that’s exactly where we are now.
Next issue…
Bank Reserves: We’re currently at DEFCON 2
Now let’s talk about bank reserves—the cash that commercial banks hold in their accounts at the Federal Reserve. This is where the rubber really meets the road.
Smell that burning?
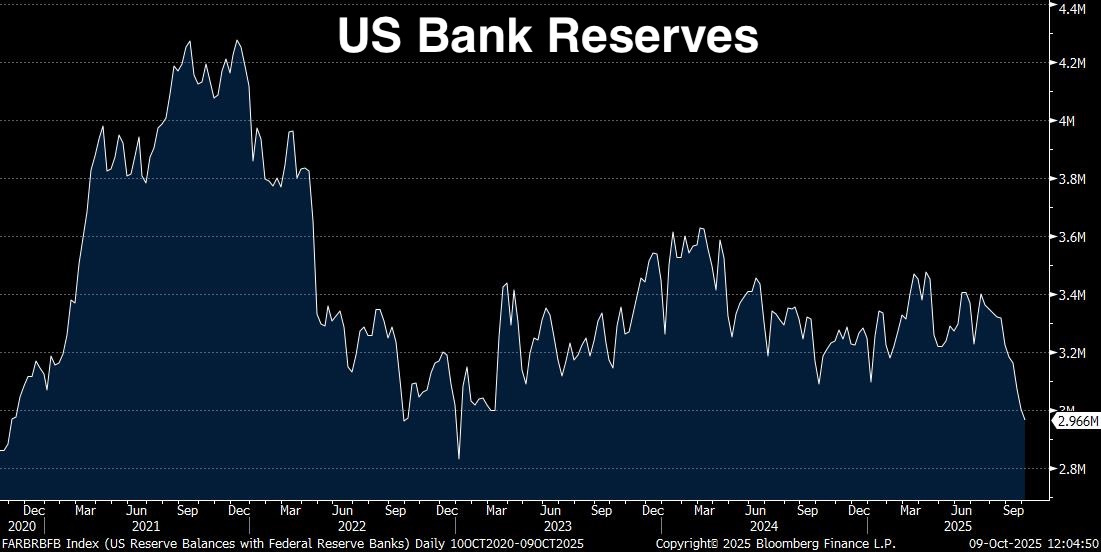
That’s because bank reserves just dropped to $2.9 trillion. And since the September 2021 peak, reserves have declined by a whopping $1.3 trillion.
Let me explain why this matters so much.
The 10% of GDP Threshold
Jerome Powell has been very clear about this: the Fed starts getting nervous when bank reserves fall below roughly 10-11% of GDP.
This isn’t some arbitrary number. It’s based on extensive Fed research, surveys of banks, and—most importantly—actual experience from what happened in September 2019 (more on that disaster in a moment).
So where are we now?
Let’s do the math:
Current bank reserves: $2.96 trillion (as of last week)
Current U.S. GDP: $30.486 trillion (Q2 2025)
Reserves as % of GDP: 9.71%
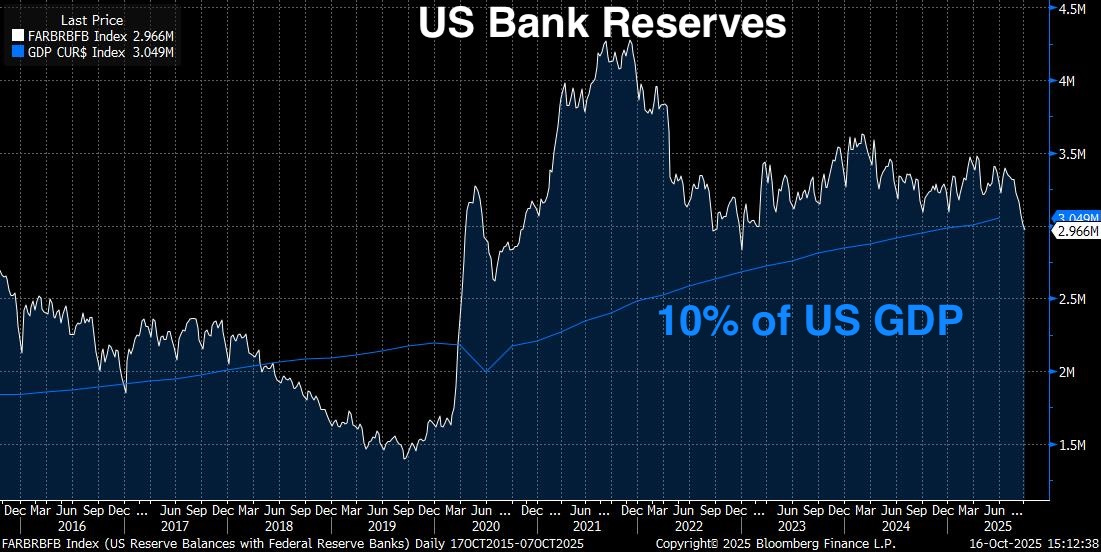

Oops.
We’re now below the 10% threshold that the Fed has identified as the minimum level for “ample reserves”—the level where the financial system can function smoothly.
According to the Fed, reserves should stay between $2.8 trillion and $3.4 trillion for smooth market functioning. But with GDP at $30.5 trillion, that 10% threshold means reserves should ideally be above $3.05 trillion.
We’re now at $2.96 trillion.
Put simply, we’re not just approaching the danger zone—we’re already in it. With the RRP now essentially empty, there’s no cushion left.
Think about it this way. Back in January when I first wrote about this issue, we had:
Bank reserves: ~$3.4 trillion
RRP: ~$600 billion
Combined liquidity: ~$4 trillion
Today we have:
Bank reserves: ~$2.96 trillion
RRP: ~$5 billion (effectively zero)
Combined liquidity: ~$2.96 trillion
That’s a drop of over $1 trillion in total system liquidity in less than a year.
And here’s the kicker: the Fed is still conducting Quantitative Tightening at $25 billion per month.
Every. Single. Dollar. Of QT now comes directly out of bank reserves.
The Ugly Math
Let’s game this out, because the math is actually pretty straightforward—and pretty alarming.
The Fed has said reserves should stay between $2.8 trillion and $3.4 trillion for “smooth market functioning.” We’re at $2.96 trillion, and with GDP at $30.5 trillion, the 10% threshold is $3.05 trillion.
We’re already $90 billion below where we should be for “ample reserves.”
At $25 billion per month of QT, we’re moving further into the danger zone with each passing week.
Except that’s not how this actually works in practice.
You see, bank reserves don’t decline in a nice, smooth, linear fashion. They’re lumpy. The Treasury General Account (TGA)—the government’s checking account at the Fed—swings wildly based on tax receipts and government spending patterns.
When tax receipts come in, money flows from bank reserves into the TGA, temporarily draining reserves further. When the government spends, reserves replenish.
Look at those charts above carefully. See the volatility of Bank Reserves in 2024 and 2025? Those aren’t random fluctuations—they’re the TGA effects we’re describing. And notice how the lows keep getting lower.
That last big drop in reserves we saw? That wasn’t just QT—it was QT plus year-end window dressing plus TGA movements.
The weekly decline of $326 billion in reserves was one of these lumpy drawdowns. But it illustrated just how fast reserves can evaporate when conditions align.
Why This Time May Be Different (and Worse)
Now, some of you might be thinking: “James, didn’t we have a similar situation in 2019 when reserves fell to $1.5 trillion and everything worked out fine?”
Great question. Yes—and no.
In 2019, when reserves fell to $1.5 trillion, that represented about 7% of GDP (GDP was ~$21.4 trillion then). The system seized up. The repo market exploded. The Fed panicked and started printing money again.
We’ll come back to this episode in detail shortly—because the parallels to today are significant.
But today, reserves are at 9.71% of GDP—and we’re already below the 10% threshold that Powell has said marks the floor for ample reserves.
So why am I saying this is worse?
Three reasons:
First, the absolute size of the financial system has grown. The banking system is bigger, balance sheets are bigger, and the amount of reserves needed to keep the plumbing working smoothly has increased. That 7% in 2019 caused a crisis; we’re already showing stress at 9.71% today—and that stress point is likely to get worse as we drift lower.
Second, we no longer have the RRP buffer. In 2019, the RRP barely existed. But in the post-Covid world, the financial system got used to having this extra liquidity cushion. Now it’s gone, and the system has to readjust to operating without it.
Third—and this is critical—regulatory requirements have gotten stricter. After the 2008 financial crisis and the more recent regional banking crisis in 2023, banks face tougher liquidity requirements. They need to hold more high-quality liquid assets (HQLA) to meet regulations like the Liquidity Coverage Ratio (LCR). Bank reserves are the highest quality liquid asset.
As reserves decline, banks get closer to their regulatory minimums. And when they get close, they start behaving defensively—pulling back on lending, hoarding liquidity, and charging higher rates for overnight funding.
Which brings us to the light that’s starting to flash red...
😰 The SOFR Spread is Widening
If falling bank reserves and a drained RRP are mere stop signs we have blown through as we head toward a liquidity crisis, now let’s look at a red light flashing ahead.
The SOFR/Effective Fed Funds spread.
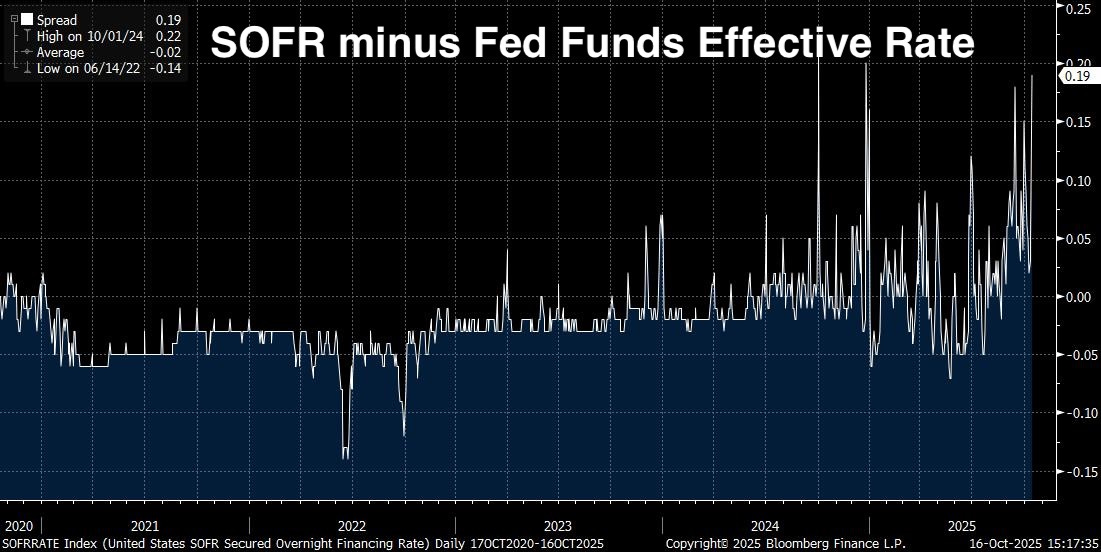
For those unfamiliar with the plumbing of the financial system, let me break this down.
SOFR (Secured Overnight Financing Rate) is the rate at which financial institutions can borrow cash overnight using US Treasury securities as collateral.
It replaced LIBOR as the main benchmark for short-term rates, and it’s calculated based on actual transactions in the Treasury repo market—about $1 trillion in daily trading volume.
The Effective Federal Funds Rate (EFFR) is the rate at which banks lend reserve balances to each other overnight, unsecured.
In normal times, these two rates trade very close together—within a few basis points (hundredths of a percent). They’re both overnight rates, both tied to Fed policy, both reflective of short-term funding conditions.
Makes sense they should be almost exactly the same.
When things are normal, of course.
But when SOFR starts trading noticeably above EFFR, it’s flashing a warning. It means secured lending—the kind backed by Treasuries—is suddenly more expensive than unsecured lending between banks.
That’s backwards. Normally, lending against rock-solid collateral like Treasuries should cost less, not more. So when the reverse happens, it tells you something in the system is off—usually that reserves are getting tight or balance-sheet space is shrinking.
Think about it: banks are basically saying, “I’d rather lend to you with no collateral at a lower rate than take your Treasury collateral at a higher rate.” That doesn’t happen in a healthy, liquid market. It happens when liquidity is starting to dry up.
The Spread is Widening—Structurally
Now look at that chart again. Notice anything familiar?
The spread has been widening steadily through 2024 and into 2025. It’s not just noise or temporary volatility—this is a structural shift.
The current spread is 0.19 (or 19 basis points). That might not sound like much, but in the world of overnight funding, it’s big.
And here’s what’s really alarming: look at the progression.
The average spread in the 2020-2022 period: roughly -0.02 (yes, negative)
The low on June 14, 2022: -0.14 (deeply negative)
The high on October 1, 2024: 0.22
Current spread: 0.19
We’ve gone from negative to positive and stayed positive. This isn’t a spike—it’s a regime change.
This is a market alarm warning that reserves are too tight.
Why the SOFR Spread Matters So Much
Here’s why this matters more than almost any other indicator:
The SOFR/EFFR spread is a real-time market signal. It’s not a lagging indicator like GDP. It’s not a survey like consumer confidence. It’s actual money, being borrowed and lent, in the largest and most liquid funding market in the world.
When this spread widens persistently, it means:
Banks don’t have excess reserves to lend freely - If they did, they’d be arbitraging this spread away by lending in the SOFR market at higher rates.
The Fed’s Open Market Operations aren’t sufficient - The Fed has a Standing Repo Facility (SRF) that’s supposed to prevent funding stress by allowing banks to borrow against Treasuries at a set rate. The fact that SOFR is trading elevated despite this facility existing tells you demand for reserves exceeds what the Fed is providing.
Year-end pressures are getting worse - Banks face extra scrutiny on their balance sheets at quarter-end and year-end for regulatory reporting. The fact that these pressures are now bleeding into regular trading days suggests the baseline level of reserves is too low.
We’re one shock away from a 2019-style spike - Right now we’re seeing structural elevation. But we’re not (yet) seeing panic. In September 2019, the overnight repo rate didn’t gradually rise—it exploded from 2% to 10% essentially overnight. We’re seeing the warning signs that precede that kind of event.
The Fed Knows Exactly What This Means
Don’t think for a moment that the Fed isn’t watching this closely. The SOFR spread is one of the key indicators the New York Fed’s trading desk monitors every single day.
They know what it means.
They know what happened last time it widened like this.
And they know what’s coming if they don’t act.
Let’s go back in time for a moment, shall we?
🥸 September 2019 Repo Revival?
September 17, 2019. A date that should live in infamy for anyone paying attention to Fed policy.
Why?
Because that morning, the overnight repo rate—the rate at which banks lend to each other overnight using Treasury securities as collateral—suddenly spiked from around 2% to 10%.
Ten. Percent. Overnight.
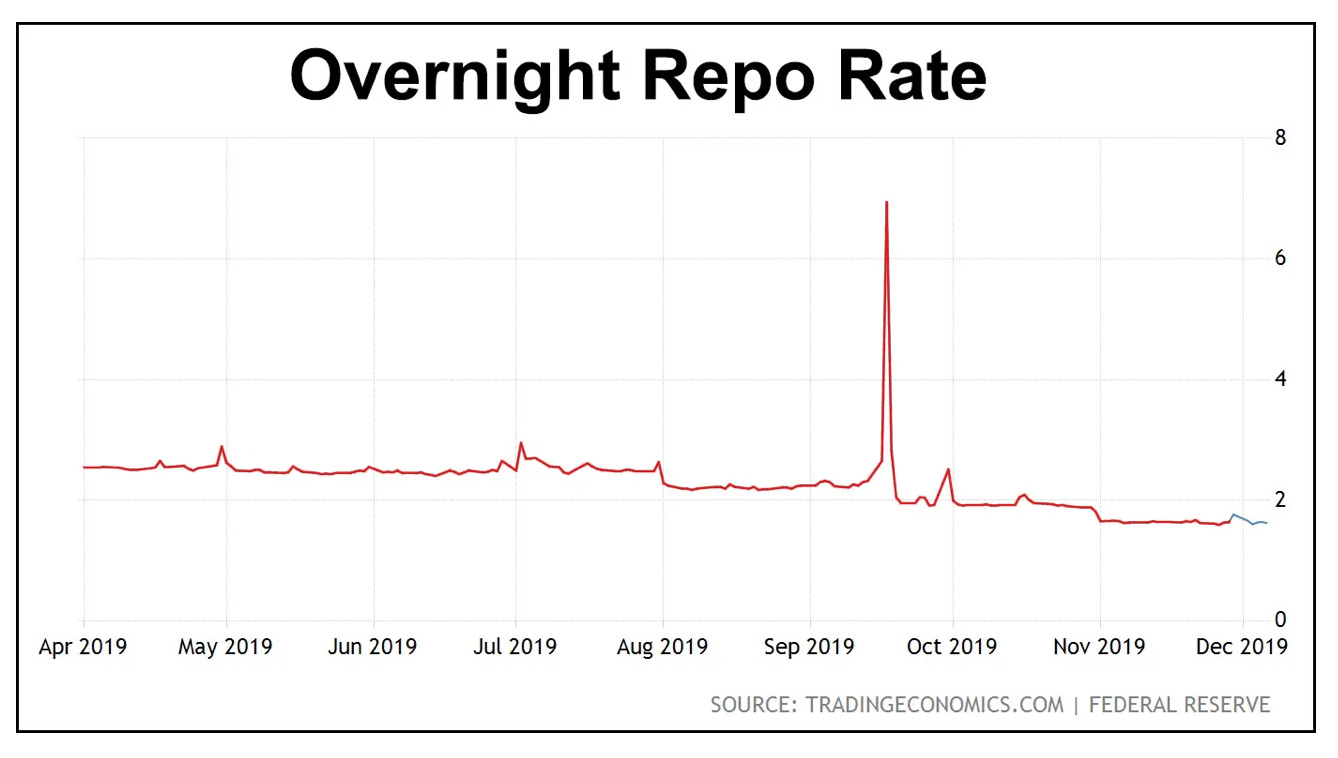
To put that in perspective, the Fed’s target rate at the time was 2.00-2.25%. The repo rate had jumped to five times the Fed’s policy rate in a matter of hours.
Banks were literally screaming for cash. The financial system’s plumbing had frozen.
What happened?
Bank reserves had fallen too low.
After the Great Financial Crisis, the Fed had ballooned its balance sheet from under $1 trillion to over $4.5 trillion through various QE programs. But starting in 2017, they began Quantitative Tightening—shrinking the balance sheet by letting bonds mature without reinvesting the proceeds.
By September 2019, reserves had fallen to approximately $1.5 trillion—about 7% of GDP at the time (GDP was roughly $21.4 trillion). The Fed thought this was fine.

They were wrong.
Why It Happened: The Technical Details
Several factors converged on that September day:
Corporate tax payments - Mid-September is a major corporate tax deadline. Companies withdrew reserves from the banking system to pay Uncle Sam, temporarily draining liquidity.
Treasury settlement - A large Treasury auction had just settled, pulling additional reserves out of the system.
No buffer - Unlike today where we had the RRP as a cushion (before it was drained), in 2019 reserves were the only source of liquidity.
Regulatory constraints - Post-2008 regulations meant banks were less willing to lend out reserves, even at elevated rates, because they needed to maintain certain ratios.
The result? A liquidity crunch that threatened to cascade through the entire financial system.
The Fed’s Response: QE Before Covid
Here’s the part most people forget:
The Fed panicked—and rightly so.
Within hours, they announced emergency repo operations, injecting tens of billions of dollars into the overnight funding market. Over the following weeks, they:
Conducted daily repo operations, adding hundreds of billions in temporary liquidity
Announced they would start buying Treasury bills again (i.e., expanding their balance sheet)
Effectively ended QT months ahead of schedule
Began Quantitative Easing in October 2019
That uptick starting in late 2019? That’s QE. That’s the money printer firing up.
This was SIX MONTHS BEFORE COVID. Six months before lockdowns. Six months before anyone had heard the word “coronavirus” outside of virology departments.
The Fed restarted QE not because of a pandemic, not because of a recession, not because of a financial crisis in the traditional sense.
They restarted QE because bank reserves had fallen too low and the financial system’s plumbing broke.
Now let’s compare 2019 to today:
September 2019:
Bank reserves: $1.5T (7% of GDP)
RRP: Essentially didn’t exist
Fed policy: QT at $50B/month
Warning signs: Repo rate volatility, reserves declining steadily
Breaking point: One bad day with tax payments + Treasury settlement
Fed response: Emergency repo ops, restart QE within weeks
October 2025:
Bank reserves: $2.96T (9.71% of GDP)
RRP: Essentially empty (~$5B, down from $2,400B)
Fed policy: QT at $25B/month
Warning signs: SOFR spread elevated, reserves declining, Powell telegraphing concerns
Breaking point: TBD (but approaching fast)
Fed response: TBD (but we know exactly what these monetary arsonists they’ll do)
The setup is identical. We’re just at an earlier stage of the crisis.
In 2019, reserves were at 7% of GDP when things broke. We’re at 10% now—but the system is more complex, larger, and potentially more fragile given 2023’s regional banking stress.
What’s Different This Time
There are a few key differences between 2019 and ironically—they all make the situation worse:
1. The Treasury Needs to Issue WAY More Debt
In 2019, the federal deficit was around $1 trillion annually—large by historical standards, but manageable.
Today? We’re running deficits of $2+ trillion annually with no end in sight. The Treasury must issue massive amounts of debt to fund the government. And every dollar of Treasuries issued potentially soaks up liquidity from the banking system.
Where did most of that funding come from recently? The RRP being drained as money market funds bought T-Bills instead.
But now the RRP is empty. The easy money is gone.
2. The Fed’s Balance Sheet is MUCH Larger
In 2019, the Fed’s balance sheet was around $3.8 trillion when the repo crisis hit.
Today, even after $2 trillion of QT, it’s still around $6.9 trillion.
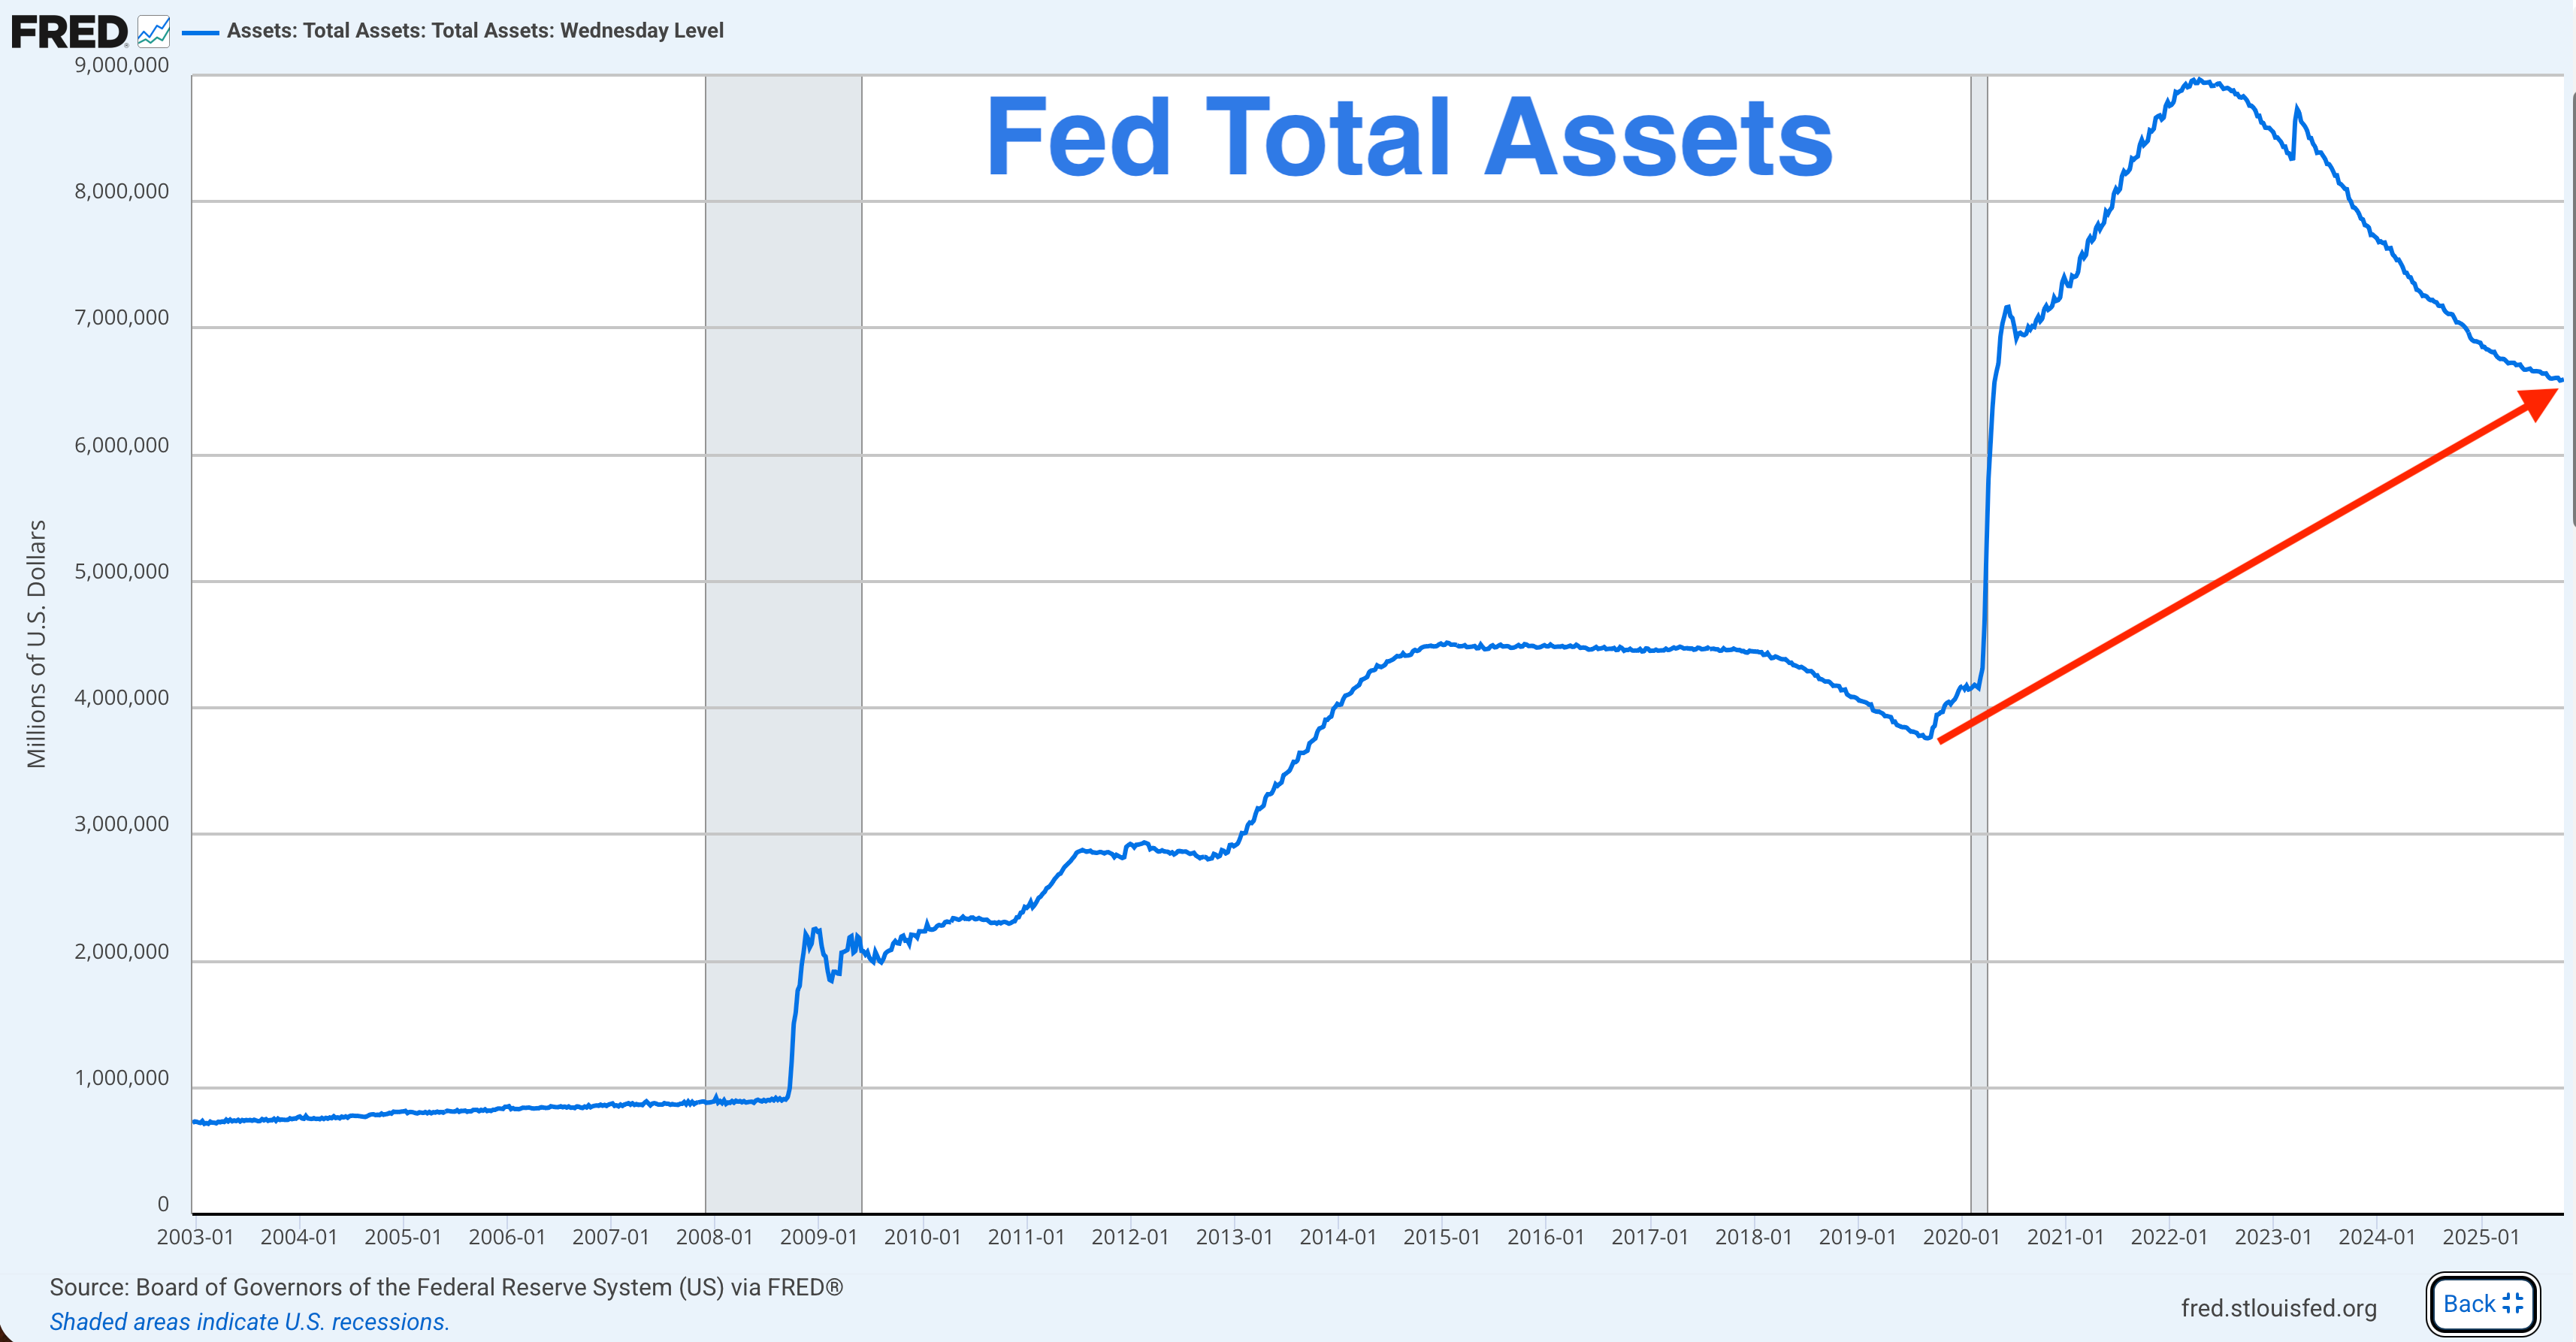
Why does this matter? Because the Fed is supposed to be “normalizing” its balance sheet—getting back toward pre-crisis levels. But they can’t. Every time they try, they run into the same problem: insufficient reserves.
The Fed has basically backed itself into permanent QE. They can’t shrink meaningfully without breaking the system, and they can’t stay this big without stoking inflation.
Good luck with that.
3. We’re Seeing Cracks in The System at HIGHER Reserve Levels
This is perhaps the most alarming thing.
In 2019, the crisis hit at 7% of GDP in reserves.
Today, we’re seeing warning signs at 9.7% of GDP.
What does that tell you? The financial system now requires a higher baseline of reserves to function smoothly. The economy, the banking system, and the leverage is all bigger, and regulatory requirements are stricter, so…the buffer needed is larger.
If 7% of GDP broke the system in 2019, and we’re already seeing stress at 9.7% today, how much lower can we go before something breaks? 9%? 8.5%?
We’ll soon find out.
The Fed Knows This—And They’re Already Telegraphing
Powell didn’t offhandedly say the Fed “may stop shrinking the balance sheet in the months ahead.”
This was a deliberate signal.
The Fed is preparing the market for a policy shift. They’re trying to avoid the 2019 scenario where they got caught flat-footed and had to execute an emergency pivot that looked panicky.
This time, they want to look like they are in control.
But make no mistake—control is an illusion and the outcome is the same. QT is ending. QE is coming.
The only question is: will they wait for something to break first, or will they act preemptively?
🫣 Why the Fed is Terrified
OK, so we’ve established that reserves are critically low, the RRP is empty, the SOFR spread is widening, and we’ve seen this movie before in 2019.
Now let’s dig into why the Fed cares so much about reserve levels, and what actually happens when this liquidity crisis becomes acute.
What Bank Reserves Actually Do
Bank reserves are deposits that commercial banks hold at the Federal Reserve. Every major bank has a reserve account at their regional Federal Reserve Bank.
These reserves serve critical functions:
Settlement of Interbank Transactions - When Bank A’s customer sends money to Bank B’s customer, the banks settle that transaction by moving reserves between their Fed accounts. Reserves are the ultimate form of money in the banking system—they’re how banks pay each other.
Meeting Regulatory Liquidity Requirements - After 2008, regulators implemented strict liquidity rules. The Liquidity Coverage Ratio (LCR) requires banks to hold enough high-quality liquid assets (HQLA) to survive a 30-day stressed funding scenario. Bank reserves are the highest quality liquid asset—they literally ARE money. They count at 100% value for LCR purposes.
Providing a Buffer for Unexpected Outflows - Banks need reserves to handle unexpected deposit withdrawals, loan drawdowns, margin calls, and other cash needs that pop up. Without adequate reserves, banks become fragile.
Why 10% of GDP Matters
When reserves fall below roughly 10-11% of GDP, banks start exhibiting stressed behavior:
They become less willing to lend reserves to other banks overnight
They hoard liquidity against unexpected needs
They charge higher rates for short-term lending (hello, SOFR spread!)
They pull back on lending to the real economy
They become more defensive on their balance sheets
We’re at 9.71% of GDP. We’re not approaching this threshold—we’re already there.
The monetary transmission mechanism is already starting to break down.
The 2023 Banking Crisis Trauma
The Fed and regulators are traumatized by the March 2023 regional banking crisis.
Remember Silicon Valley Bank? Signature Bank? First Republic?
Those failures happened because those banks had poor liquidity management. They held long-term bonds that had lost value due to rising rates, and when depositors pulled their money, the banks couldn’t meet the outflows without selling those bonds at massive losses.
What stopped the crisis? The Fed stepping in with the Bank Term Funding Program (BTFP)—allowing banks to borrow against their underwater bonds at par value.
I wrote all about this when it happened, and if you want to understand it better and learn more about the BTFP, you can find that article right here:

and here:

That crisis is still fresh. Now imagine trying to shrink the overall supply of reserves (via QT) in an environment where banks are still scarred, regulatory scrutiny is intense, and you’re already below the 10% threshold.
You can see why Powell is already talking about stopping QT.
The GDP Growth Trap
Here’s the kicker: GDP keeps growing.
Current GDP: $30.5 trillion
Growth rate: roughly 2–3% per year
If GDP grows 3% this year, that’s about $900 billion of new output.
Now, if the Fed wants reserves to stay at roughly 10% of GDP, reserves would need to grow by about $90 billion each year just to keep pace.
But instead, the Fed is shrinking reserves by about $300 billion a year ($25B a month × 12).
Even if the Fed stopped QT today and simply held reserves steady at $2.96T, the reserves-to-GDP ratio would still fall over time—from 9.7% to 9.5%, then 9.2%, and lower.
To keep that ratio stable—or bring it back above 10%—the Fed has two choices:
a) Grow reserves in line with GDP (a modest QE), or
b) Let the ratio drift down until something breaks.
There is no third option.
Put simply, the Fed is trapped on a hamster wheel. 🐹🤡
What’s Coming: The Inevitable Pivot
Based on everything we’ve covered, here’s what I expect:
Timeline: Q1 2026 (Most Likely)
The Fed formally announces an end to QT at either the December or January FOMC meeting. They’ll frame it as “technical adjustments to maintain ample reserves” rather than a policy shift.
Powell’s already telegraphed this is coming “in the months ahead.”
Could it happen earlier if we get another sharp reserve drawdown around year-end? Absolutely. The Fed might be forced into an emergency announcement, just like 2019.
From Pause to Full QE
But here’s the thing: The Fed won’t just stop QT. They’ll eventually have to reverse it.
Why?
The federal government is running $2+ trillion annual deficits. The Treasury needs to issue massive amounts of debt. With the RRP drained, where does the funding come from?
Not enough private demand to absorb $2 trillion annually without yields spiking. And if banks use reserves to buy Treasuries, that drains reserves further—making the problem worse.
That leaves the Fed as buyer of last resort. Again.
Plus, with GDP growing 2-3% annually, reserves need to grow by $60-90 billion per year just to maintain the current ratio. That’s QE, not pause.
The Historical Pattern: They Overshoot
Look at 2008-2014: The Fed didn’t just do a little QE. They did QE1, QE2, Operation Twist, QE3. The balance sheet went from $900B to $4.5T.
Then look at 2019-2020: They restarted balance sheet growth in October 2019 (buying $60B/month of T-Bills). Then Covid hit and they went nuclear—adding $5T in months.
When the Fed pivots to easing, they overshoot. Always.
So when QT ends—and it will—don’t expect modest, gradual QE. Expect the fire hose.
The Fed will probably buy $60-100 billion per month of Treasury bills to “maintain ample reserves and ensure smooth market functioning.”
That’s QE. They just won’t call it that.
They’ll likely come up with some fancy ‘non-permanent’ acronym instead.
But we all know what it really is.
🤑 The Money Printer Pivot Plan
If you have been following me for a while, you know what I am about to say.
If not, here it is…
When central banks fire up the money printer, there’s only one rational response: own assets they can’t print.
That means gold and Bitcoin.
Let me be very clear about where I stand: I believe these are the two most important assets to own for the coming QE cycle, and I’m personally heavily weighted toward Bitcoin.
Gold: The Market is Already Pricing in QE
Gold has been money for 5,000 years. Central banks hold it. Investors hold it. It has zero counterparty risk and can’t be printed.
And right now? Gold is absolutely crushing every other asset class.
As of today, gold is trading over at $4K per ounce.
Gold has rallied over 70% since I first started warning about liquidity issues in January 2025 when it was around $2,500.
The market isn’t waiting for the Fed to announce QE. The market is already pricing it in.
Why is gold moving so aggressively?
Because smart money—central banks, sovereign wealth funds, institutional investors—sees exactly what we’ve discussed today. They see:
Reserves below critical levels
The RRP drained
The Fed trapped into restarting QE
Massive government deficits requiring monetization
The dollar’s purchasing power being systematically destroyed
Central banks are buying gold at record pace. They’re diversifying away from dollar reserves and into the one asset that has maintained its value for millennia.
Gold simply maintains its purchasing power while paper currencies collapse.
Bitcoin: The Superior Asymmetric Play
Now let’s talk about Bitcoin—and why I believe it’s the single best positioned asset for the coming QE tsunami.
Bitcoin is the first truly scarce digital asset. There will only ever be 21 million Bitcoin. Ever. That’s hardcoded into the protocol.
While the Fed can print infinite dollars, nobody—not the Fed, not governments, not corporations, not miners—can print more Bitcoin.
But here’s why I think Bitcoin has significantly more upside than even gold:
Bitcoin is Harder Money Than Gold
This might be controversial, but it’s true: Bitcoin is harder money than gold.
Gold’s supply increases every year through mining—roughly 1.5-2% annually. Gold’s scarcity is relative, not absolute.
Bitcoin’s supply increases on a fixed, declining schedule (halving every four years), and will reach its absolute maximum of 21 million coins around 2140. After that, zero new Bitcoin. Ever.
Bitcoin is the hardest money that has ever existed in human history.
Bitcoin Follows Gold’s Moves—With a Multiplier
I recently wrote about this relationship in detail. You can find that here:

TL;DR: Bitcoin tends to follow gold’s major moves, but with amplified gains.
When gold rallies on monetary debasement fears, Bitcoin rallies harder because:
It has superior monetary properties (absolute scarcity vs relative scarcity)
It’s earlier in its adoption curve (bigger % gains possible)
It has additional utility beyond store of value (payment network, programmable money)
It benefits from network effects as adoption grows
Look at what’s happened since January:
Gold: +70% (from ~$2,550 to $4,348)
Bitcoin: +7% (from ~$100,000 to $107,000)
Bitcoin is “lagging” gold’s move significantly right now. But historically, when gold makes a sustained move higher on monetary policy concerns, Bitcoin eventually catches up—and often exceeds gold’s percentage gains.
Bitcoin is Earlier Stage
At current prices, gold’s total above-ground value is ~$30T—a mature, widely held asset across households, investors, and central banks.
Bitcoin’s market cap is around $2.2 trillion. It’s only 16 years old.
If Bitcoin captures even a fraction of gold’s monetary premium as institutions and nation-states adopt it as a reserve asset, the upside is enormous.
Bitcoin Solves Problems Gold Can’t
Bitcoin isn’t just digital gold—it’s better than gold for the modern world:
Portability: You can move $1 billion in Bitcoin across the world in minutes. Try that with gold bars.
Divisibility: Bitcoin is divisible to 8 decimal places. Gold requires complex fractional ownership structures.
Verifiability: You can verify your Bitcoin holdings instantly. Gold requires assayers and trust.
Self-custody: You can hold Bitcoin yourself with no counterparty risk. Gold requires vaults, security, insurance.
Programmability: Bitcoin can be used in smart contracts and financial applications. Gold can’t.
Most importantly: Bitcoin opts you out of the sovereign debt Ponzi entirely.
The US government has $38 trillion in debt. They’re running $2+ trillion deficits annually. There’s no path to paying this back through taxes or growth.
The only way out is inflation—printing money to devalue the debt away.
Gold protects you from this. But Bitcoin does something more: it exists completely outside the system. It can’t be confiscated (if properly custodied), can’t be debased, can’t be manipulated by central banks.
Why I’m Overweight Bitcoin
Let me be crystal clear: I own both gold and Bitcoin, but I’m significantly overweight Bitcoin relative to gold.
Gold is the safe, proven play. It’s boring, reliable, and will preserve your purchasing power through the QE cycle.
Bitcoin is the asymmetric opportunity. It has all of gold’s monetary properties plus additional advantages, and it’s earlier in its adoption curve.
If I’m right about QE coming—and all the evidence says I am—both will do extremely well.
But Bitcoin has the potential to dramatically outperform because:
It’s harder money (absolute vs relative scarcity)
It’s earlier stage (bigger % gains possible)
It’s benefiting from accelerating institutional adoption
It solves problems gold can’t in a digital age
It historically amplifies gold’s moves with higher percentage gains
The risk/reward on Bitcoin is simply superior, assuming you can handle the volatility.
The Bottom Line
We’ve seen this movie before. September 2019 was the preview.
QT is dead. QE is coming. Probably Q1 2026, possibly sooner.
When the Fed pivots—and they will—you want to be holding assets that benefit from currency debasement.
Assets they can’t print.
I’m personally overweight Bitcoin relative to gold because I believe it offers superior long-term upside. But both deserve to be core holdings.
Not cash—because every dollar printed makes your existing dollars worth less.
Not long-term bonds—because negative real yields destroy wealth.
The liquidity crisis is here. The warning lights are flashing. The Fed knows it.
The money printer is about to go brrrrrr again.
And Bitcoin is poised to benefit from it.
That’s it. I hope you feel a little bit smarter knowing why the Fed is about to pivot from QT to QE, why the liquidity situation is so precarious, and why Bitcoin and gold are the assets to own for the coming monetary expansion.
If you enjoyed this free version of The Informationist and found it helpful, please share it with someone who you think will love it, too!
Talk soon,
James✌️
15 years ago I was reading Richard Russell. Today I’m reading James Lavish. I was buying Gold 15 years ago and I buy BTC now. I know Richard is looking down with a grin. Thanks, James.
Nice Work.