

✌️ Welcome to the latest issue of The Informationist, the newsletter that makes you smarter in just a few minutes each week.
🙌 The Informationist takes one current event or complicated concept and simplifies it for you in bullet points and easy to understand text.
🫶 If this email was forwarded to you, then you have awesome friends, click below to join!
Full disclosure, and as many of you already know: I hold bitcoin and hard assets personally and professionally, and I sit on the board of a bitcoin treasury company, so weigh my opinion accordingly. Nothing here is individual advice, and I don’t know your personal situation. If you have an advisor, these are conversations you should be having with them.
Today’s Bullets:
What Is Fiscal Dominance?
Didn’t the Fed Just Raise Rates?
Where Does All That Interest Go?
So, Are We In It?
Inspirational Tweet:

Fiscal dominance.
If you’ve spent any time on X lately, you’ve likely seen those two words being referenced, sometimes at the center of a debate.
On one side, there’s Lyn Alden, who shared Jim Bianco’s chart above with a simple caption: “If you want fiscal dominance in a chart, here it is.”
On the other side, there are global macro economists like Dario Perkins, who argue it only counts once the Fed can no longer hit its inflation target because of the deficit. After all, the Fed just raised rates last month, not what you’d expect if the deficit was driving policy.
In any case, the debate comes down to how it all impacts our own savings and investments. And it’s no surprise that the phrase is resurfacing, since the fiscal year 2026 just ended with a deficit of $2 trillion, pushing total US debt over $40 trillion.
To understand all this, and the impact of it, we must ask some simple and not-so-simple questions.
Like, what exactly is fiscal dominance? If we are already in it, why would the Fed raise rates? What happens to all the interest on that US debt? And most importantly, what does any of this mean for our own money?
All good and important questions, and ones that we’re going to answer, nice and easy as always, right here today.
So pour yourself a big cup of coffee and settle into your favorite seat, as we figure out what fiscal dominance really is, and whether we’re already living in it, with this Sunday’s Informationist.
Partner spot

This week, Ledger users lost funds after purchasing devices through a third-party reseller in a suspected supply chain attack. Ledger is advising recent buyers to hold off on setup, or to move funds to a new device with a new seed.
Like the Coldcard incident this summer, your takeaway should be this: eliminate all single points of failure. If your long-term bitcoin depends on one key, one provider, one location, or one person, then one failure is all it takes to lose everything.
Whether it be a supply chain attack, retirement attack, or even a heart attack: no single failure should put your bitcoin out of reach for you or your family.
Unchained built a short self-assessment to show you where you stand. It’s 3–7 questions, takes about three minutes, and highlights which dependencies deserve a closer look. The answer might not be what you think. Your answers are evaluated in your browser and are never stored.
Find your single point of failure →
What Is Fiscal Dominance?
First things first, let’s start with the term fiscal dominance itself, break it apart and define it better.
Fiscal refers to government-associated finances. That means taxes, the Congressional budget, or the borrowing required to bridge the gap between those two.
Monetary refers to Fed-related financial activity. In other words, interest rate policy as well as adding or removing liquidity from the system, i.e., Quantitative Easing (QE) or Quantitative Tightening (QT).
What we’ve been taught is that the Fed runs separately from the government, as we are told over and over again that the Fed is an independent institution. And so, if inflation is running hot, the Fed will raise rates to slow things down, regardless of what that does to Washington’s borrowing costs.
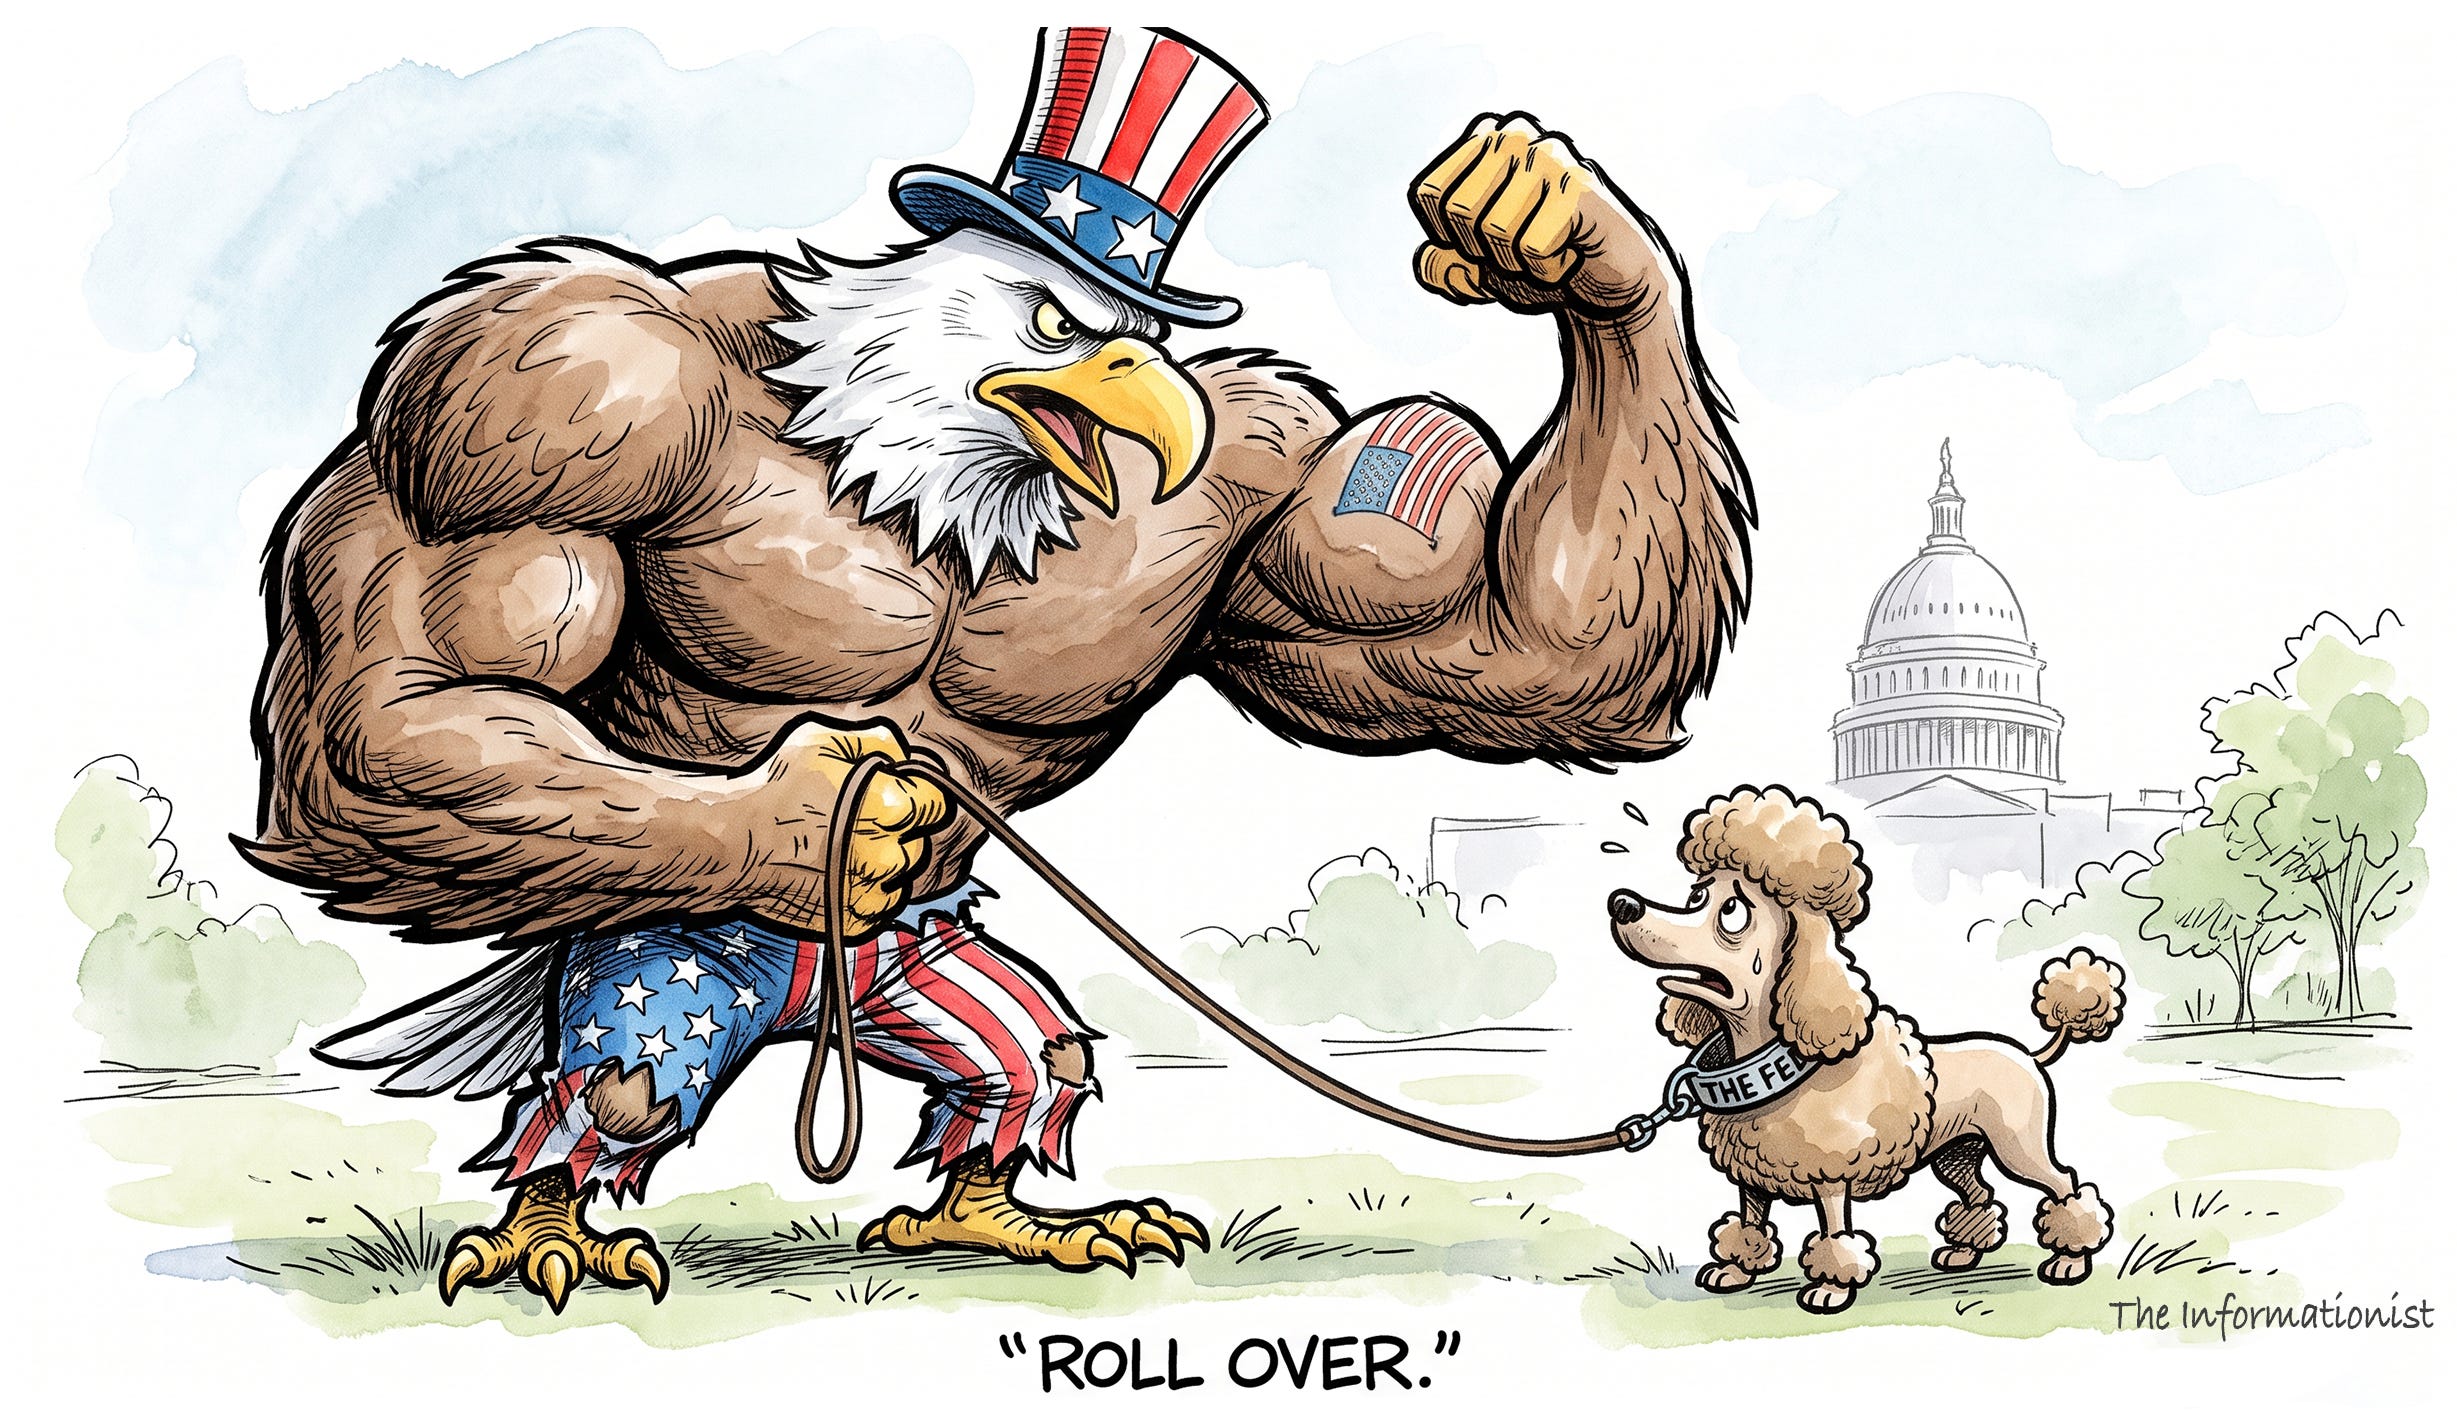
Fiscal dominance is when this relationship is reversed. This happens when the government’s debt load becomes so large that it starts calling the shots, explicitly or implicitly directing the Fed’s decisions around it.
Kind of like the bank’s biggest borrower getting a say in what the bank charges.
This whole idea goes back to 1981, when economists Thomas Sargent and Neil Wallace wrote a paper called Some Unpleasant Monetarist Arithmetic. In their unpleasant arithmetic, they explain that if the government won’t manage its deficits, tighter money today can mean higher inflation later.
Solid title, by the way. It’s nice to see when economists have a little sense of humor.
I walked through exactly what that arithmetic looks like for today’s Fed back in April, when I asked whether anyone could be the next Volcker. Short answer: the math says no.

In any case, the fights on X start when people try to pin down exactly when that reversal happens.
Like Dario Perkins, the economist we referred to in the opening of this issue. Here’s his full definition, posted October 1: fiscal dominance is when the Fed can’t hit its inflation target, either because “raising rates makes inflation worse” or because “the Treasury won’t allow it,” both because of the deficit.
Using that strict measure, he doesn’t think we’re there.
Lyn Alden, on the other hand, posted a couple of days later: “Fiscal dominance is a spectrum and we are firmly within that spectrum now.”
What she’s saying is, fiscal dominance begins when it’s “unclear” that rate hikes fix inflation, and when “the central bank just starts making exceptions for financial stability.”
So what do we notice about their arguments?
Well, I would honestly say they’re running the same two tests, but Lyn just sets the bar earlier, not lower.
In my opinion, her reason for the earlier bar is important for our money and investments.
How?
She points out that the strict definition is the “end-stage terminal” version, where it’s “already priced in.” And she follows that up with, “Border zones matter because that’s where money is made.”
In other words, by the time everyone agrees we’re in fiscal dominance, the markets will have already reacted and many investors will be too late.
Which brings us right back to what I believe is the skeptics’ best point. If we are already in it, why would the Fed raise rates?
Excellent question. Let’s talk about that next.
Didn’t the Fed Just Raise Rates?
It did. And if you side with the literal definition, then that’s your Exhibit A.
On September 16, the Fed raised its target rate by a quarter point, to a range of 3.75% to 4%. The vote was 12 to 0, and it was the Fed’s first hike since July 2023. The statement the Fed delivered with the hike said that “Inflation remains elevated” and “The Committee will deliver price stability.”
Also, the Treasury bill purchases the Fed started last December had wound down to zero by August. A Fed taking orders from the deficit, as the argument goes, wouldn’t do either of those.
Fair enough.
But not so fast, my literally-defined friends.
Because over the last seven years, we’ve watched the Fed add liquidity at least three times, and each time, it seemed to go out of its way to call it something other than QE.
In September 2019, during the Repo market crisis, overnight lending markets seized up. Then in October, the Fed announced it would buy about $60 billion a month of Treasury bills. This was just days after Powell had told a room of economists in Denver, “This is not QE. In no sense is this QE.”

Then in March 2023, Silicon Valley Bank failed and the Fed launched its Bank Term Funding Program (BTFP). Between BTFP and its other emergency loans, the Fed’s balance sheet grew by about $391 billion in two weeks.
And on March 22, the Fed raised rates again.
You can see the activity here.
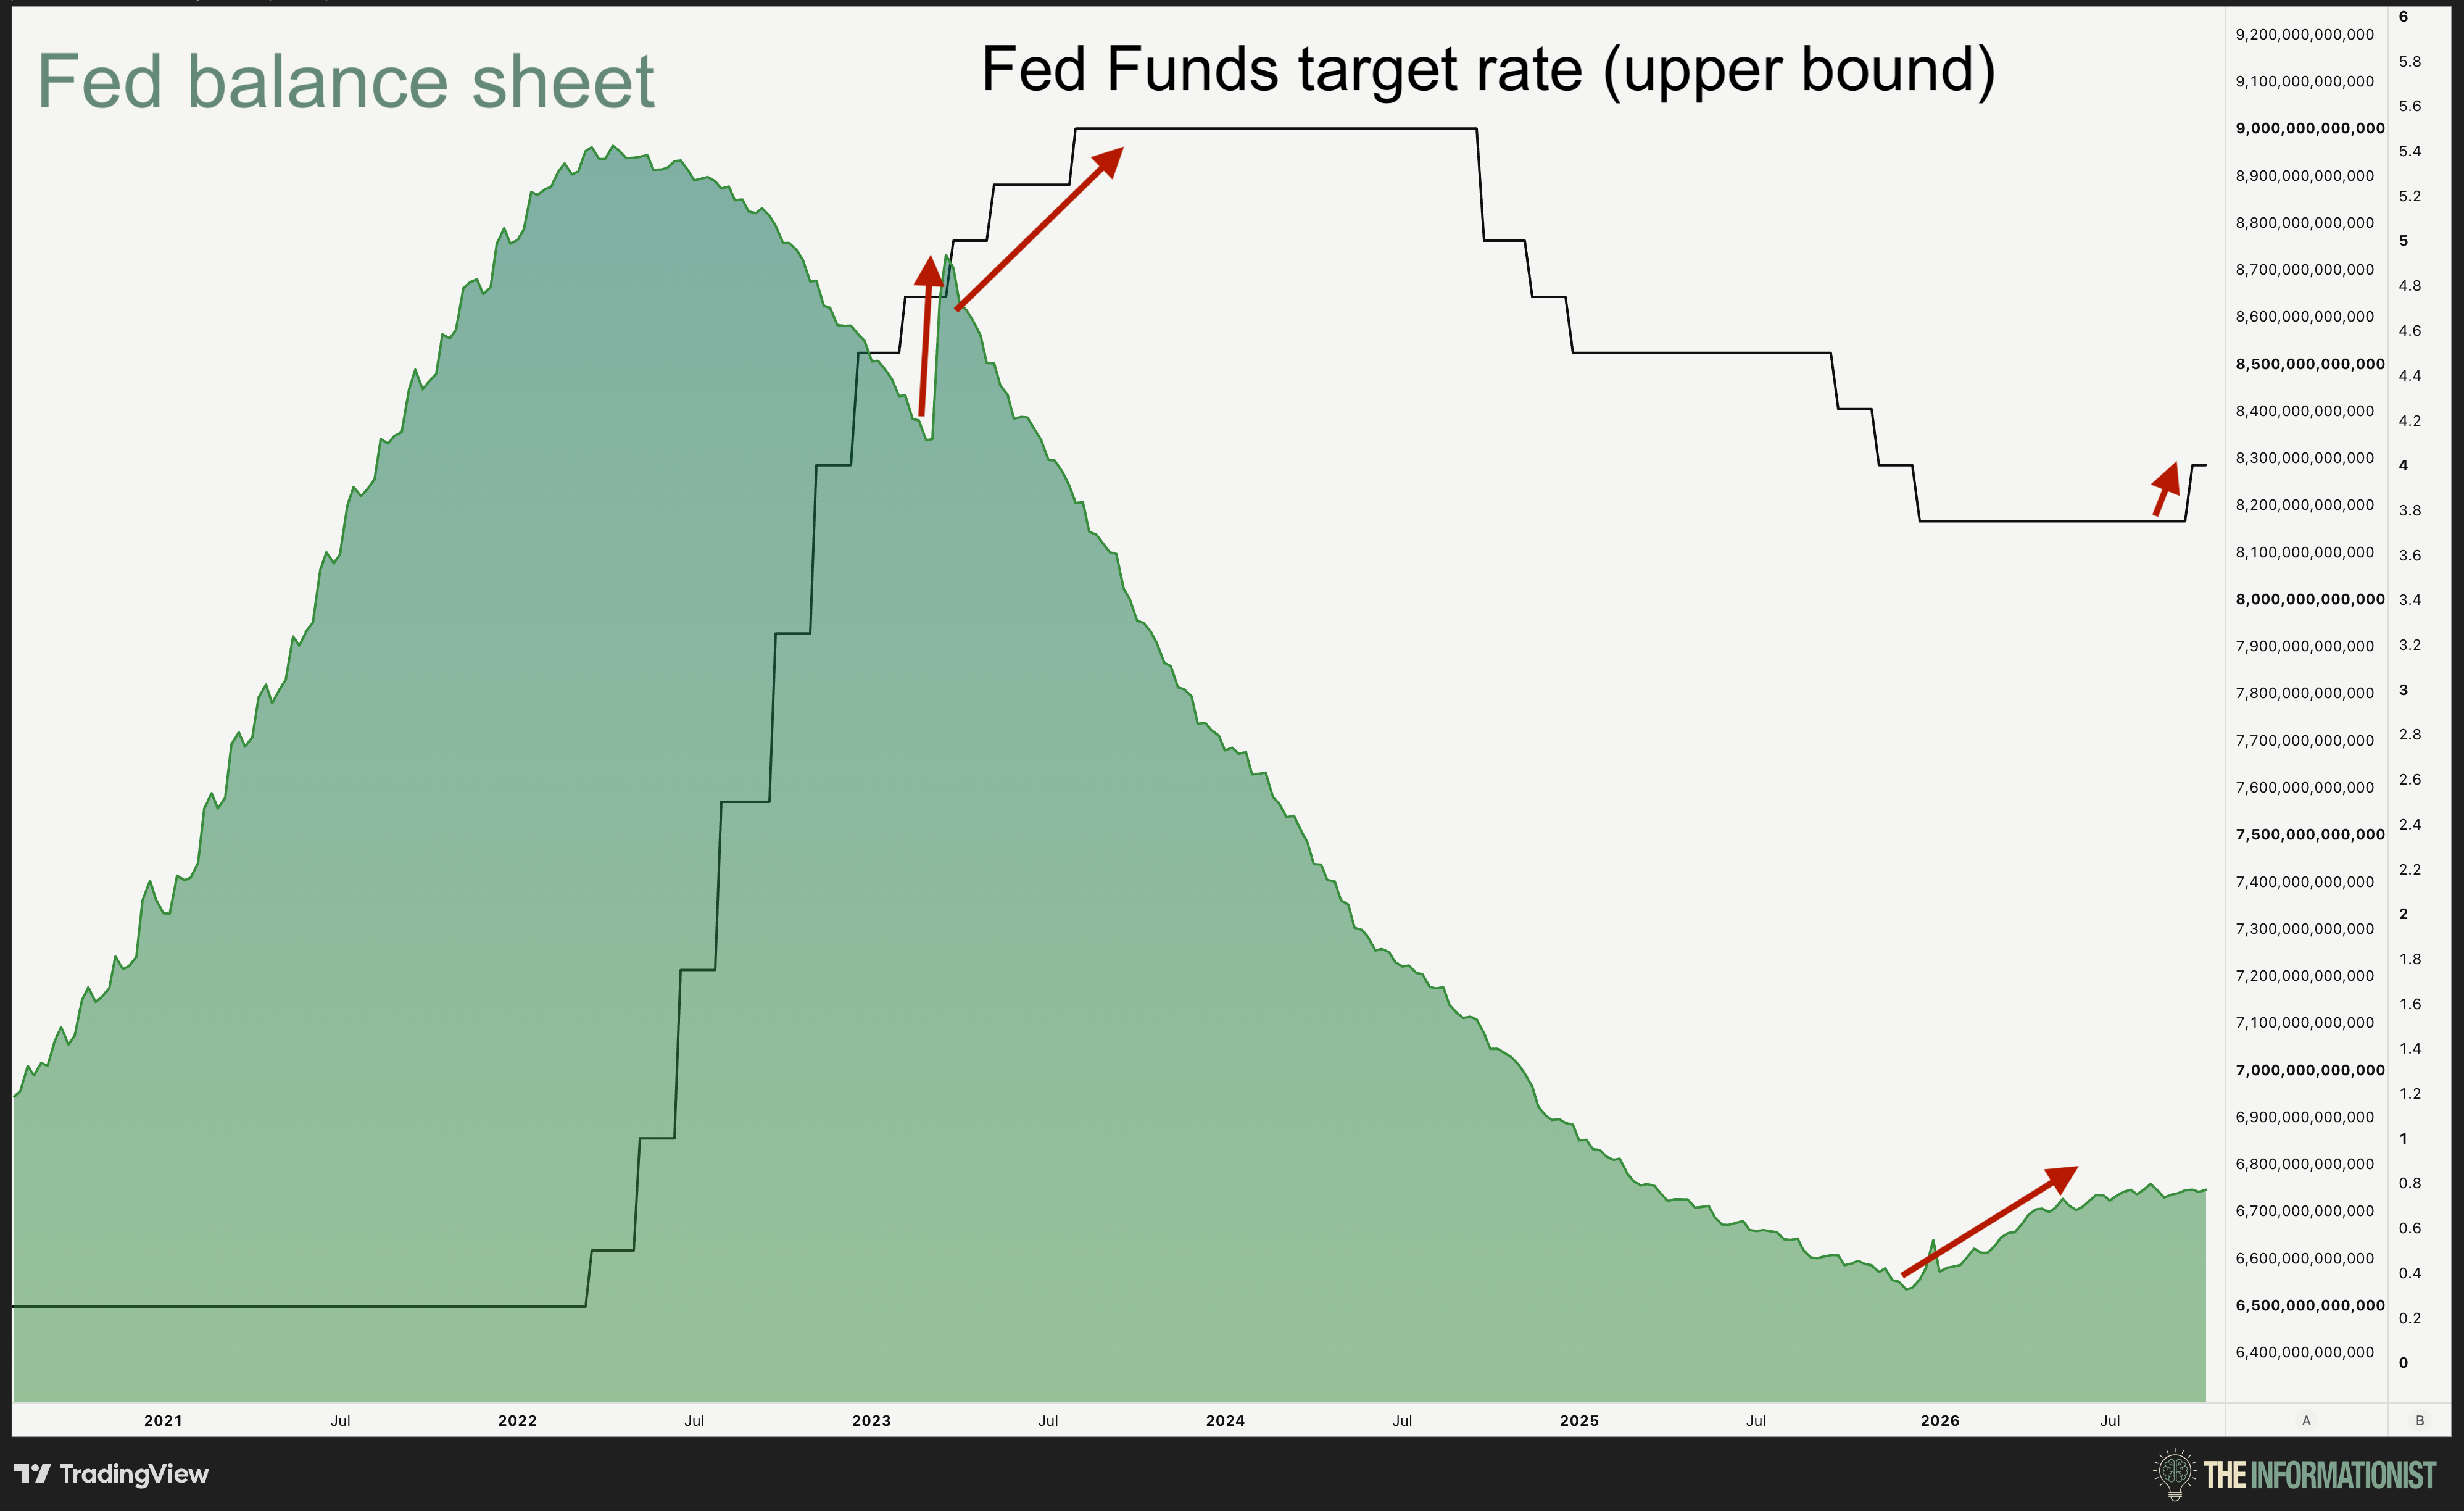
But then look at last December, when the Fed started buying Treasury bills again, $40 billion worth in the first month.
Powell’s explanation?
“That is completely separate from monetary policy.”
For the love of God, make up your mind, man.
It seems obvious to me that the intent is exactly the same in all three cases. When the financial system needed liquidity, the Fed injected it, whatever it called the program.
Some of you may recall me writing all about this last November.

TL;DR: liquidity is liquidity, regardless of the label.
This is essentially Lyn’s second test in action.
Because if you’re wondering what she means by “exceptions for financial stability,” I’d point to the Fed’s actions in March 2023, when it was raising rates while simultaneously lending billions to banks.
Back to today, in my opinion, a single rate hike doesn’t rule fiscal dominance out.
That, and there may be another reason hikes aren’t working quite the way people would expect these days.
And that has to do with where all that interest goes.
Where Does All That Interest Go?
To track the interest, take a peek at Jim Bianco’s chart from today’s Inspirational Tweet.
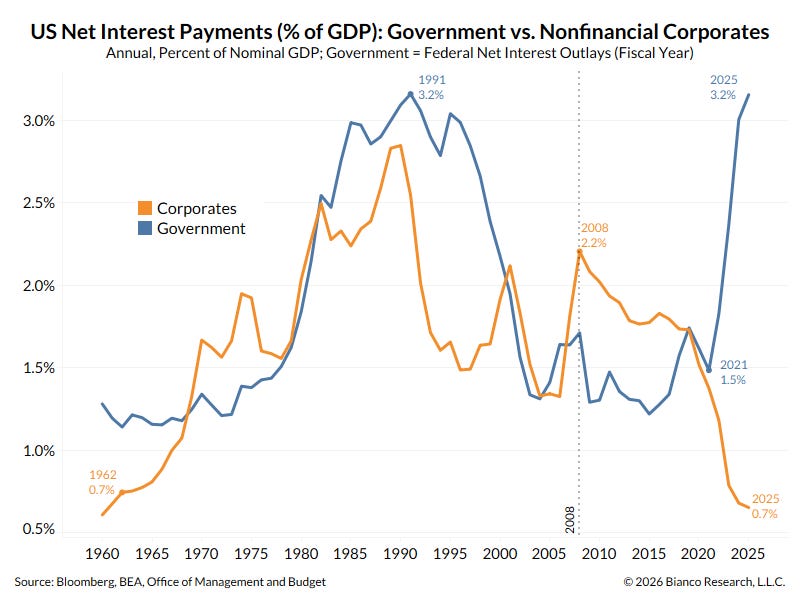
The blue line is what the government pays in interest, as a percentage of the whole economy. For 2026, that was about $1.1 trillion, which the Committee for a Responsible Federal Budget estimates is a record 3.4% of GDP.
The orange line is what American companies pay, after netting out the interest they earn on their cash. It’s down to 0.7%, the lowest it’s been since the early 1960s.
Why do these lines matter?
Well, think about it. Rate hikes are supposed to make borrowing more expensive, so we all borrow less, spend less, and as a result, inflation cools down.
Problem is, tons of companies refinanced during the years that the Fed was running ZIRP, zero interest rate policy. These same companies are sitting with piles of cash on their balance sheets, which now earns more interest when rates go up.
Oopsy.
This is the same concept as we talked about last week with homeowners sitting on mortgages below 6%.
As we all know, the biggest borrower of all is our fair government. And so, when the Fed raises rates, the Treasury pays more interest to whoever holds its debt.
Double oopsy.
And where does all that interest go?
Cullen Roche, the founder of Discipline Funds, did the math.
Roughly 30% goes to foreign holders, about 15% to the Fed itself, and the other 55% or so goes to US holders, much of that is held by banks, funds, pensions and wealthy investors.
His point is that those types of holders don’t spend much of it. As he put it, “I don’t spend one single cent of the interest income I get in my brokerage account.” If you have your cash sitting in a money market, you may be in the same boat.
Even being generous, he figures that this year’s increase in interest only adds about $21 billion of new spending in a $31 trillion economy.
His conclusion? “We’re in an era of fiscal influence.”
OK then. But if they don’t spend it, what do they do with it?
Quoting my friend Brent Johnson of Santiago Capital: “Higher rates inject more money into the economy, that money gets allocated to equities.”
Brent posted that on October 6, the day the S&P 500 and Nasdaq closed at record highs with the 10-year Treasury yielding 5.27%.
Lyn replied, “Is Brent becoming my latest ally on fiscal dominance?”
Cullen and Brent are essentially looking at the same money from opposite directions.
See, Cullen is counting how much of that interest gets spent at the store, and he’s probably right that it’s relatively small. Brent is looking at where the rest goes, and a lot of it seems to end up in the stock market.
If rate hikes are pushing money into stocks, it makes us question whether rate hikes in today’s economy actually fix inflation.
That, to me, is Lyn’s first test.
Which brings us all the way back to the question in this issue’s title.
So, Are We In It?
So, are we, in fact, in fiscal dominance?
To me, yes. I’d say we’re in the early part of it, what Lyn calls the border zone.
That said, by Dario’s strict definition, I agree that we’re not at the finish line yet. But more importantly, as Lyn points out, by the time everyone agrees on that, it’s already in the price.
Going back to what we talked about today. The Fed keeps making exceptions for financial stability, in 2019, in 2023 and again last December. And with the US government as the biggest borrower in the world, rate hikes seem to just send a good chunk of that interest right back into stocks and other assets.
That’s both of Lyn’s tests. Check and check. ✅✅
As Lyn put it, “2023 was the start of non-cyclical fiscal dominance, which means the train won’t stop.”
I agree.
So what does all of this mean for our own money?
First, more exceptions.
The next time something in the financial plumbing breaks, I fully expect the Fed to step in with some new fancy acronym or term and add more liquidity to the system.
We’ll know it’s more liquidity by the expansion of the Fed’s balance sheet.
Second, the Treasury continues to soft default day after day, year after year.
Look, I have no doubt that the Treasury will pay back every dollar it borrows. Those dollars will just be worth far less when they come back to the lenders.
Third, if yields on the long end of the bond market do continue to march higher, I’d expect the Fed to eventually step in and bring them back to earth. Cap yields yields with outright yield curve control. The final stage of central bank money manipulation we walked through back in March.

And as most of you are well aware by now, this is the overwhelming reason that I hold bitcoin, gold, and other hard assets.
In the meantime, I’ll be keeping an eye on the Fed’s balance sheet every Thursday afternoon, when it’s released, regardless of what the inevitable program happens to be called.
Because if history is any guide, the next exception will come with a brand new name.
But it will be some sort of QE, just the same.
What I’m Watching This Week
The Treasury’s year-end books, likely Tuesday. With September in the books, the Treasury wraps up fiscal 2026. The report usually hits on the eighth business day of the month, which would make it Tuesday, as Monday is Columbus Day. CBO estimates a deficit of $1,993 billion and net interest of $1,143 billion. Let’s see how the actual official numbers come out.
Bank earnings, starting Tuesday. JPMorgan kicks off third-quarter results Tuesday morning. I’m interested in hearing what their outlook is, considering the Fed just raised rates, and it’s unclear what the rate path is going to be from here.
September CPI, Wednesday. In August, consumer prices were up 3.4% over the year, and 2.4% excluding food and energy. The Fed hiked on those numbers, a hotter number would likely raise the probability of another hike this month. Fed meets again on October 27 and 28.
The Beige Book, Wednesday. The Fed’s summary of what businesses are seeing across its 12 districts, two weeks before their October meeting.
The 20-year bond auction, Wednesday. The Treasury sells $13 billion of 20-year bonds on October 21. This is not exactly the most popular bond with investors, so I’ll be watching how much demand shows up, especially with the 30-year yield at 5.6%.
That’s it. I hope you feel a little bit smarter knowing about fiscal dominance, what the debate is all about, and why I believe we’re already in it.
If you enjoyed this free version of The Informationist and found it helpful, please share it with someone who you think will love it, too!
Talk soon,
James ✌️
If you’re not yet a premium subscriber, I’d love to have you join us.
Join 1,500+ premium readers who get the Sunday issue in full every week, and What I'm Watching This Week at the close of each issue.