
💡 The Fed's "Difficult Situation"
Issue 210
✌️ Welcome to the latest issue of The Informationist, the newsletter that makes you smarter in just a few minutes each week.
🙌 The Informationist takes one current event or complicated concept and simplifies it for you in bullet points and easy to understand text.
🫶 If this email was forwarded to you, then you have awesome friends, click below to join!
👉 And you can always check out the archives to read more of The Informationist.
Today’s Bullets:
🏦 What the Fed Said vs. What Powell Revealed
📉 What the Bond Market Heard
🔺 The S-Word
💰 Where to Go From Here
Inspirational Tweet:
Six words, and possibly the Fed’s understatement of the century, uttered by Jerome Powell in what might be one of his final press conferences.
Acknowledging tension between rising inflation and a weakening economy, he also pushed back on a word that’s been increasingly floating around trading desks and financial media for weeks now.
Stagflation.
Powell: “I would reserve the term stagflation for a much more serious set of circumstances,” he said. “That was a 1970s term, at a time when unemployment was in double figures and inflation was really high and the Misery Index was super high.”
Fair point, Chairman.
He had a few more things to say about the 1970s comparison, too. We’ll get to those, as they are critical for today’s discussion.
But first, let’s see what happened over the next 48 hours.
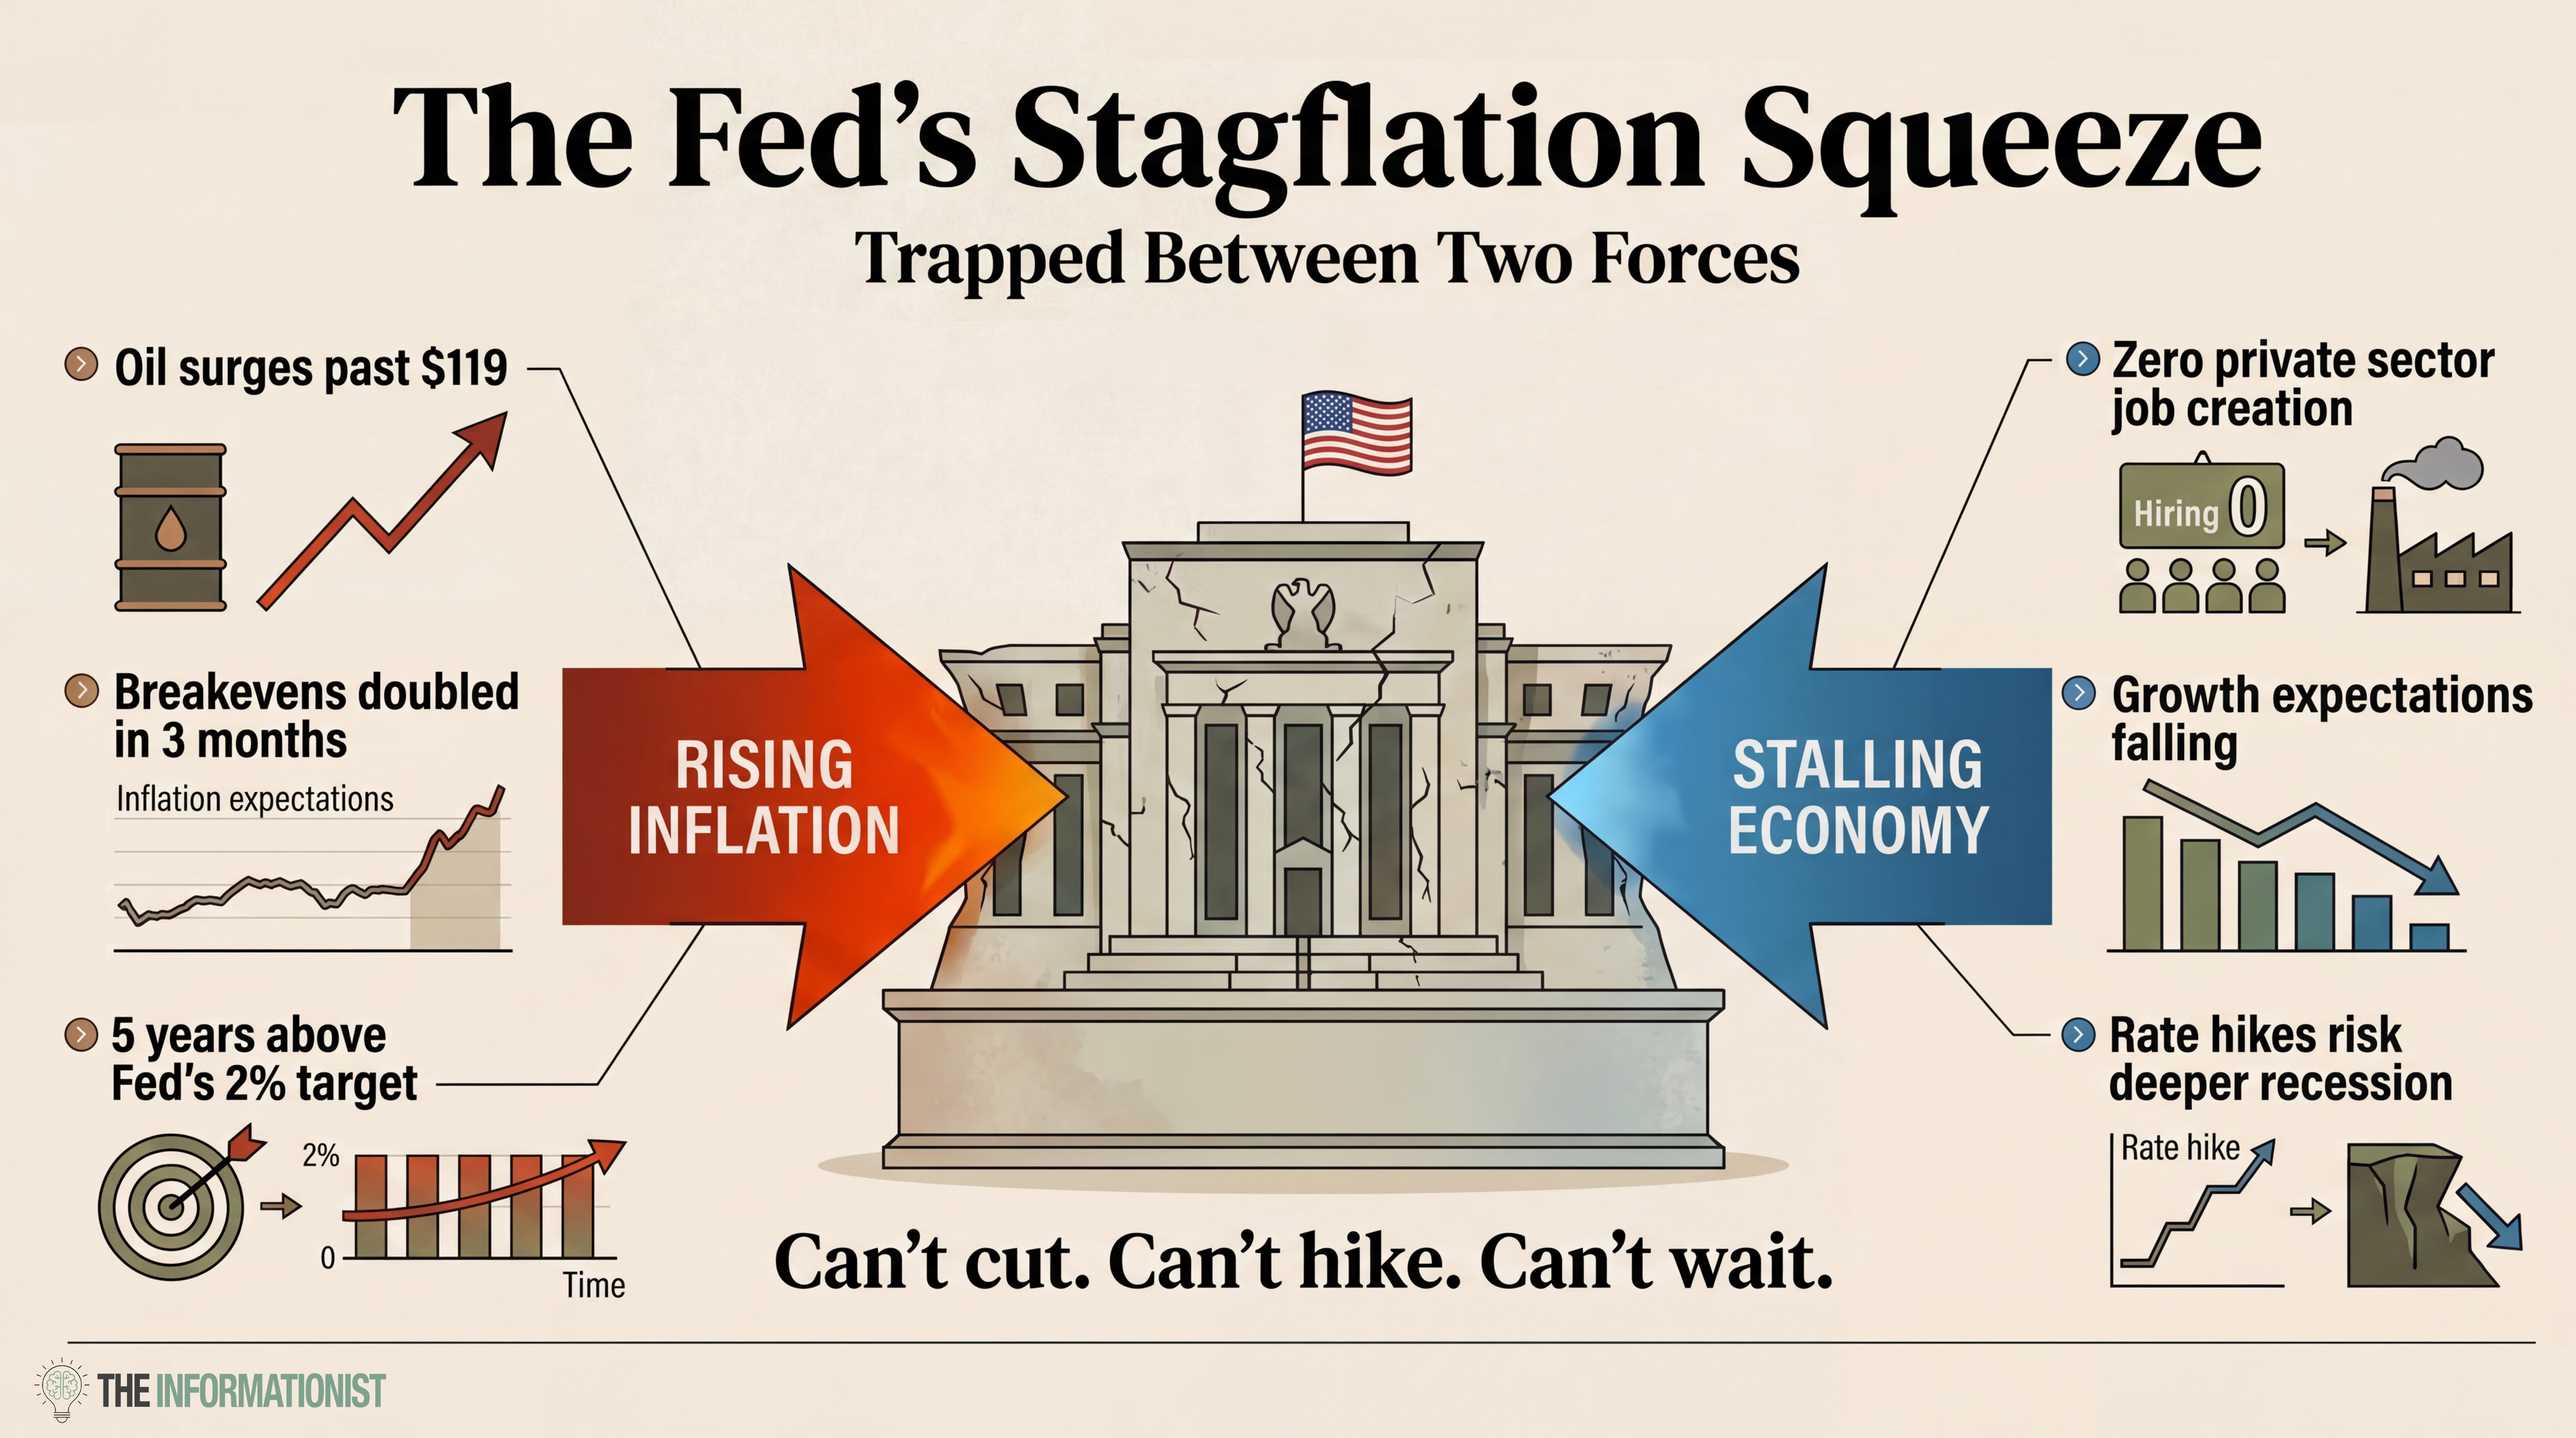
Oil surged to $119. Gold futures dropped nearly 6%, 2-year Treasury yields spiked to almost 4%, and the yield curve flashed a pattern we haven’t seen since the spring of 2008.
So is Powell right? Is this just “tension between the goals?” Or is the bond market pricing in something the Fed is all but dismissing verbally?
What does it actually mean when inflation expectations double in three months? And if the Fed truly can’t cut and can’t raise, where does that leave your portfolio?
All good questions that deserve serious consideration and answers, ones that we will sift through, nice and easy as always, here today.
So, pour yourself a big cup of coffee and settle into your favorite seat for a look at the Fed’s tightest corner yet with this Sunday’s Informationist.
Partner spot
The Downturn Advantage
The retirement system most people rely on was built for a different era—one of strong real yields, lower debt, and a stable monetary foundation. Today, inflation erodes purchasing power while taxes chip away at the savings meant to compound for decades.
Mark Moss joins Unchained for a live presentation and Q&A exploring how bitcoin is changing the retirement equation and why market downturns can create opportunities to help build generational wealth.
The event will cover:
Why the traditional retirement model is under structural pressure
How bitcoin changes the long-term retirement equation
Why downturns can create opportunities for retirement planning
March 26 · 1PM CST · Live online · Free to attend
Download the latest report from Mark Moss and Unchained, Retire Off Bitcoin: The Freedom Investor’s Guide, and you will automatically be registered for the event.
🏦 What the Fed Said vs. What Powell Revealed
Let’s start with what the Fed officially told us on Wednesday.
The FOMC released its statement at 2:00 p.m. Eastern, and if you only read that, you’d think everything was under control. Rates held steady at 3.50% to 3.75%. Economic activity “expanding at a solid pace.” Inflation “remains somewhat elevated.” The committee is “attentive to the risks to both sides of its dual mandate.”
Measured. Clinical. Carefully worded.
Then Powell stepped to the podium for the Q&A. And the tone changed.
Every quarter, the Fed releases something called the dot plot.
I’ve written all about the dot plot before, and if you are unfamiliar with this chart or want a refresher, you can find out all about them here:

For the TL;DR people: It’s a chart that shows where each committee member expects interest rates to land by each year-end. Think of it as 19 people throwing darts at a monetary policy chart, more or less.
In any case, the median dot didn’t change from December. It still implies one possible 25-basis-point cut in 2026.
One cut. Maybe.
But the distribution shifted hawkish. Powell himself noted that four or five members moved from expecting two cuts down to one. And a growing number now see just one cut or none at all. In fact, 14 of 19 members are now in that camp, up from just 7 in December.
Meanwhile, the Fed’s own inflation projections moved in the wrong direction. In December, they forecast PCE inflation at 2.4% for this year. Three months later, that number is 2.7%. Core inflation? Same thing. Up from 2.5% to 2.7%.
Both trending higher, not lower.
Those might seem like small moves. A few tenths of a percent. But when you’re the Fed and your target is 2%, the difference between 2.4% and 2.7% is the difference between “we’re getting there” and “we’re going backward.”
And then came the line that turned heads.
Powell said, “There was discussion of a rate hike at this meeting.”
A rate hike. In 2026. After a year of cutting rates in 2025, and almost every investor in the world sitting on pins and needles, waiting for the next cut.
Powell said most participants don’t view it as the baseline scenario. But the mere fact that it was discussed at this meeting and the last one tells you something about where the Fed’s head is right now.
But it was another comment during the Q&A that really caught my attention.
When asked about whether the Fed could simply “look through” the oil shock, the way central banks have in the past, Powell acknowledged something that changes the balance entirely. He pointed out that inflation has now been running above the Fed’s 2% target for “five years.”
Five years.
The pandemic. The tariffs. And now an energy shock. One after another after another. Powell admitted that looking through this one is harder precisely because of everything that came before it.
The credibility cushion is thinner than it used to be.
And on the labor market? Deutsche Bank ran the numbers after recent BLS revisions and found that over the last three months, the economy has been adding roughly 6,000 jobs per month. Not 200,000. Not 100,000.
A measly six thousand.
But Powell went further. He pointed out that when you strip out government hiring and adjust for the BLS overcounting, “effectively there’s zero net job creation in the private sector.”
Zero.
Think about that for a moment. The Chairman of the Federal Reserve just told you the private sector has stopped creating jobs. He even gave it a name: “zero employment growth equilibrium.” And then added that “it has a feel of downside risk.”
In other words, the Fed Chair is telling us the floor might not hold.
OK. So let’s put this all together.
The official press release statement basically said everything is fine. But the Q&A told an entirely different story. Inflation projections rising. Rate hikes on the table. Five years of above-target inflation eroding the Fed’s ability to look through anything. And a labor market producing nothing.
Powell described this as “tension between the goals.”
Uh huh. I’d personally call it something else.
Exactly what the bond market seems to be calling it.
📉 What the Bond Market Heard
The day after Powell’s press conference, the bond market made its opinion crystal clear.
The 2-year Treasury yield, which is considered the market’s opinion on where Fed Fund rates should be, spiked as much as 21.8 basis points intraday, hitting almost 3.96%. That’s one of the largest single-day moves in the 2-year this year.
Now, if you’re not a bond person, that number might not jump off the page. But here is what it means.
The Fed’s current target rate is 3.50% to 3.75%. When the 2-year yield is sitting below that range, the market is essentially saying: cuts are coming, we expect rates to go lower.
When it jumps above that range?
The market is saying one of two things. Either the Fed needs to raise rates from here, or cuts are off the table for a long while.
Yesterday, that’s exactly what happened. A big, sudden shift in expectations.
But the 2-year yield on its own is just one signal. What made Thursday really stand out was how it moved relative to the 10-year yield.
See, under normal conditions, the 10-year yield sits comfortably above the 2-year. You expect to earn more for lending your money for a longer period of time.
Makes sense, right?
But when the 2-year rises faster than the 10-year, the gap between them compresses. In the bond world, this is called a bear flattening.
Super fancy term, I know.
In any case, back in early February, the gap between the 2-year and 10-year was about 74 basis points. But now look.
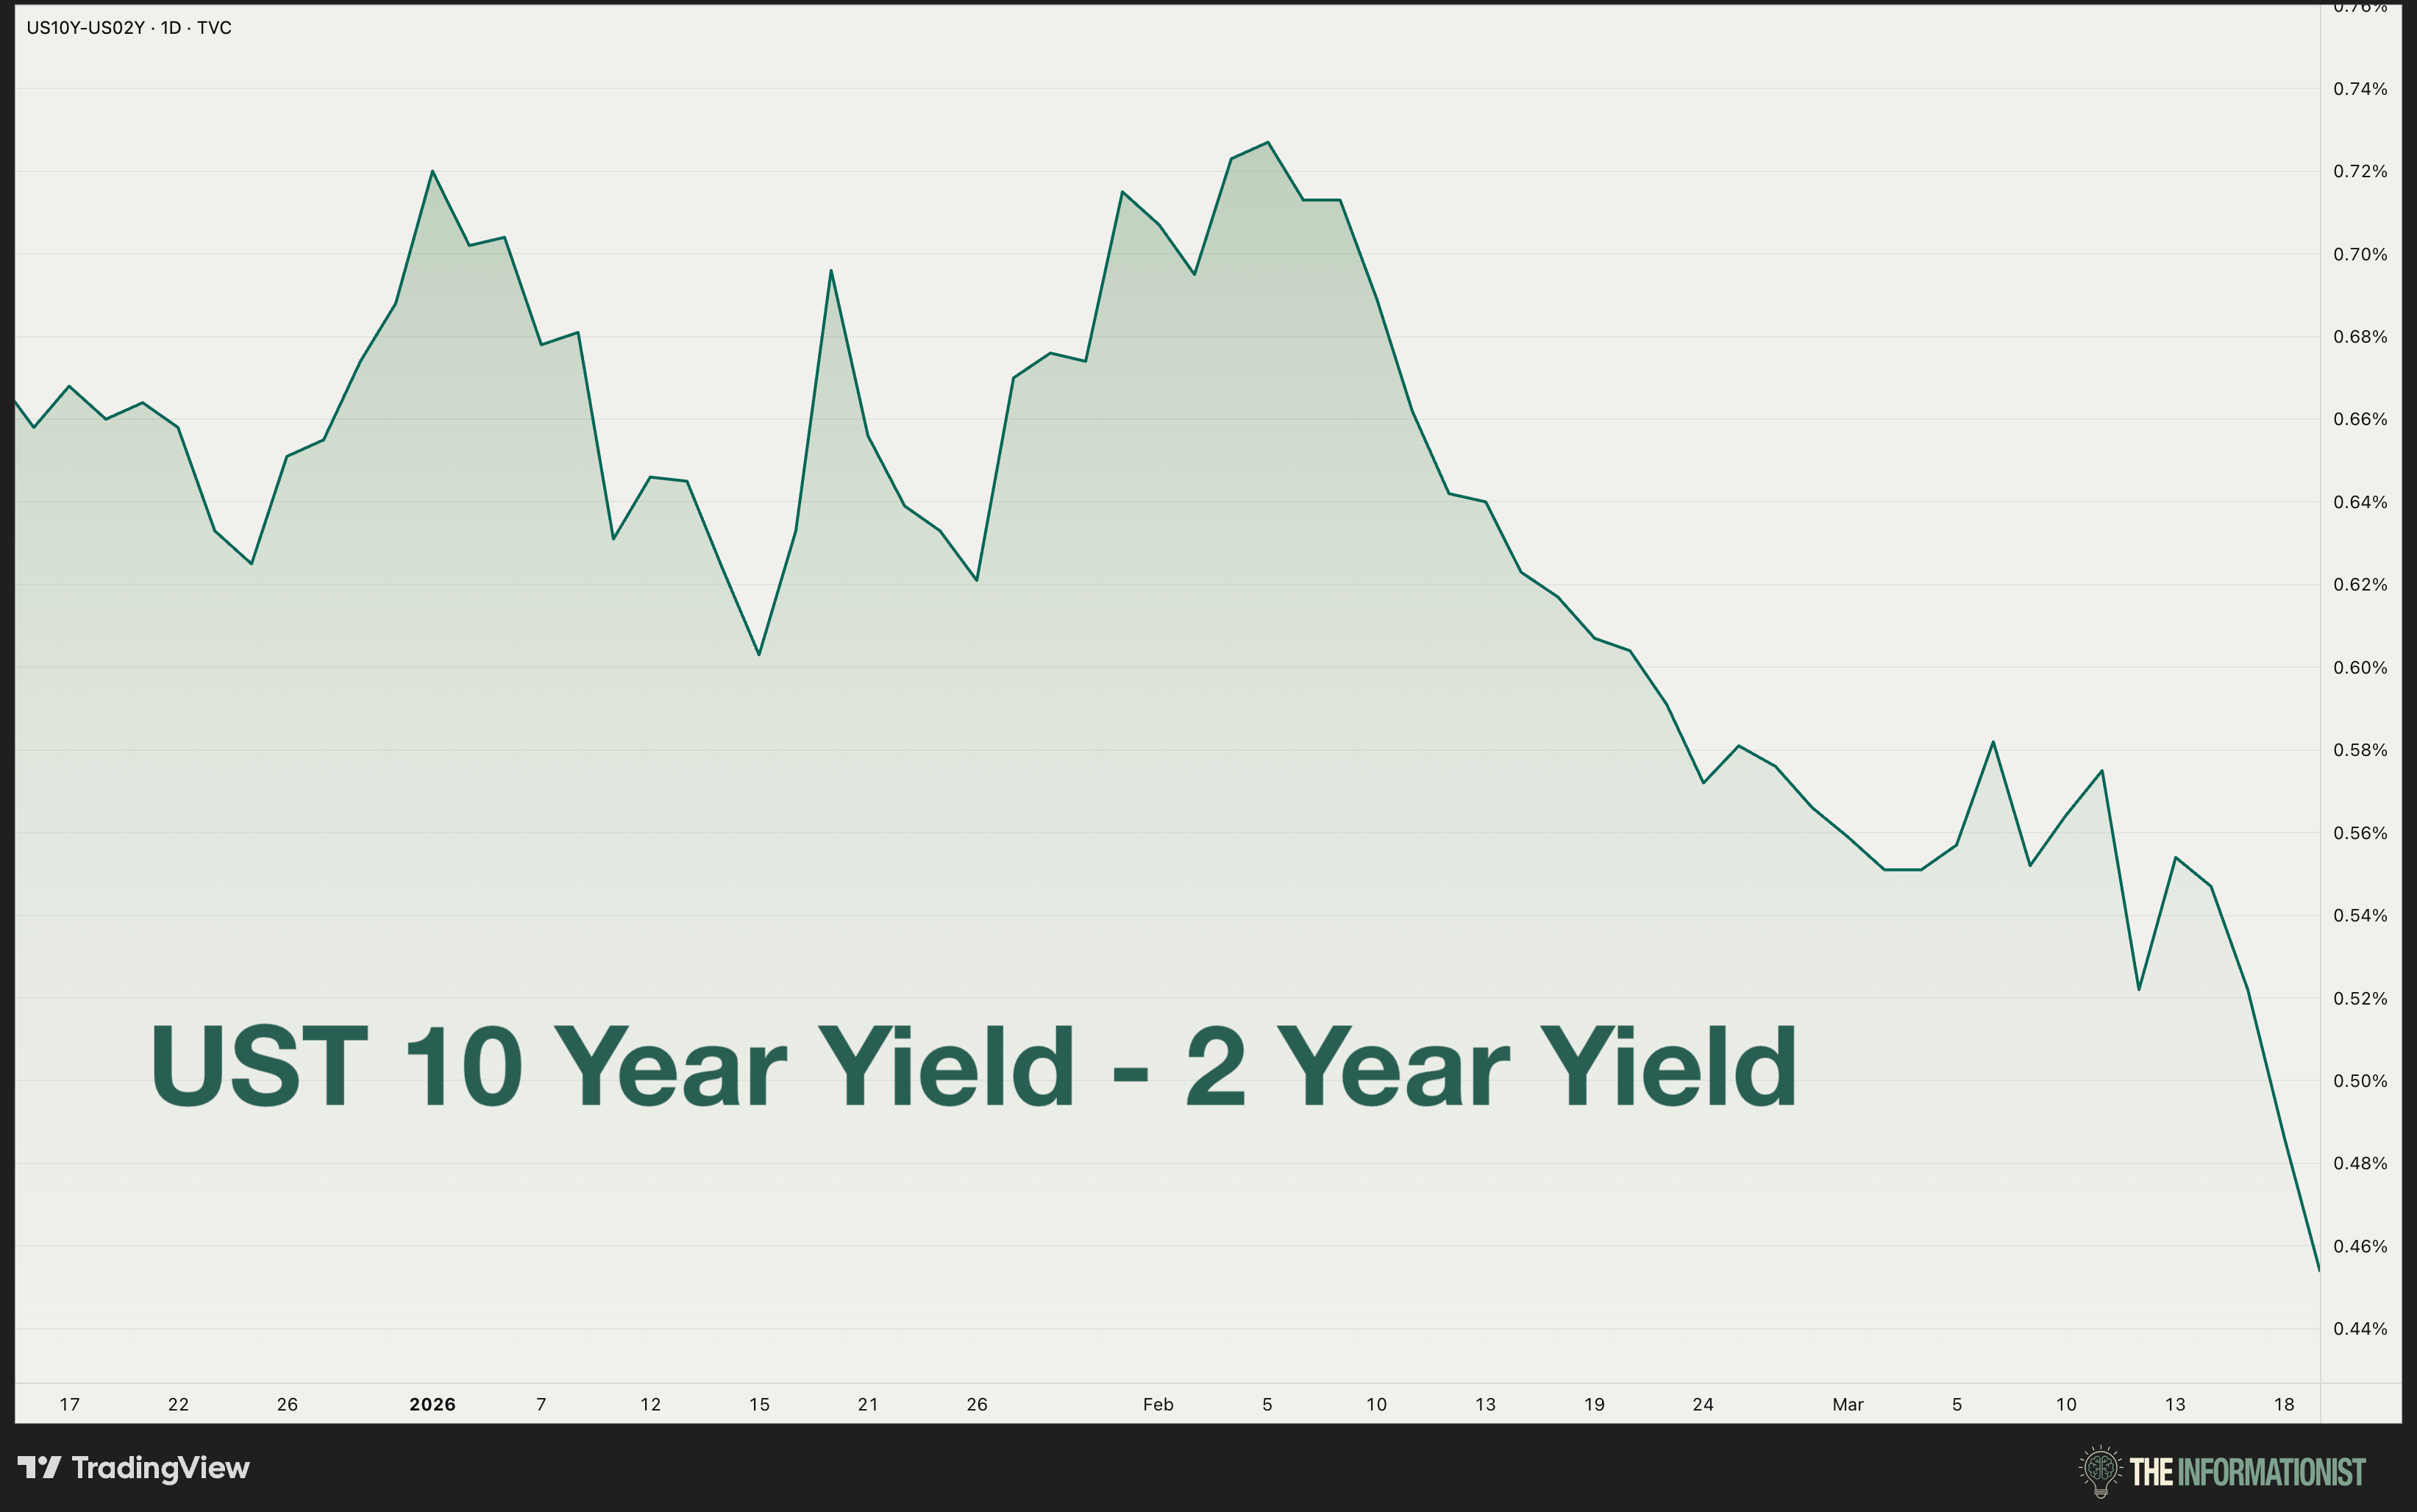
By Thursday, it had shrunk to 45. And if it goes negative, meaning the 2-year yields more than the 10-year, that’s a full inversion. And inversions have preceded every major recession in the last 50 years.
But for now, that compression is telling you two things at the same time.
Short-term rates are going up, which means investors are worried about inflation. And long-term growth expectations are going down, which means the economy is weakening.
Inflation and stagnation. At the same time.
You see where this is going.
Now, remember what Powell said about looking through the oil shock? That it depends on inflation expectations staying “well anchored?”
There’s a way to measure that.
The 1-year breakeven inflation rate compares regular Treasury yields to inflation-protected ones. The difference tells you what the bond market expects inflation to be over the next twelve months.
In mid-December, that number was 2.23%. Close to the Fed’s target. Calm. Anchored.
As of this week, it’s 5.38%.
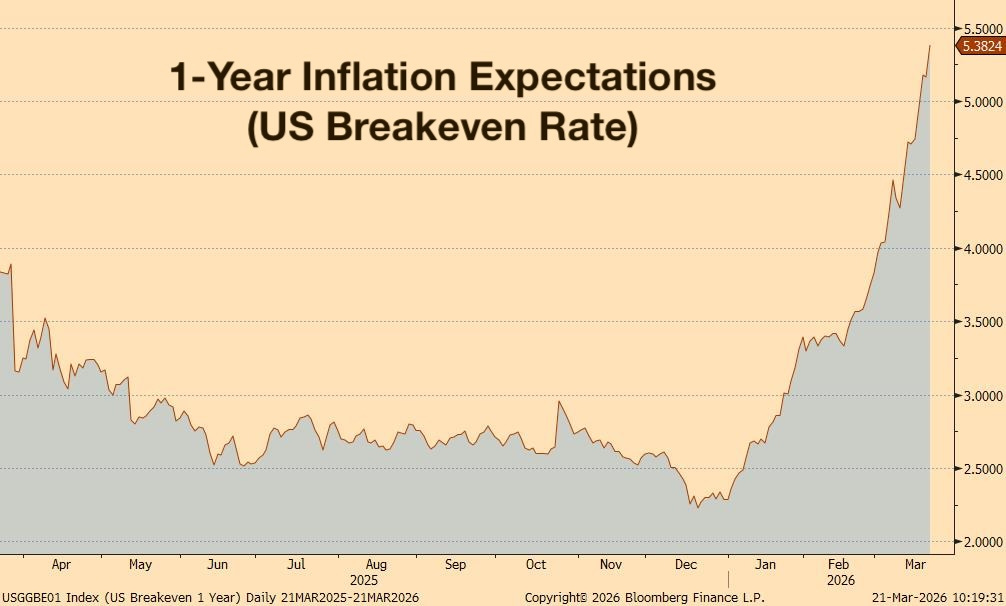
In three months, near-term inflation expectations have more than doubled. The bond market has fundamentally repriced what it expects inflation to do from here.
This is the one condition Powell himself set for when the Fed can no longer “look through” an energy shock. And by his own measure, that condition is failing.
Meanwhile, fed funds futures are telling a similar story. The market is now pricing in roughly half a rate hike by the fall. No cuts until mid-2027. A full easing cycle not until late 2027 at the earliest.
So think about what the bond market is actually saying here. The Fed can’t cut. It might have to hike. Inflation expectations are cracking. Growth is fading. Stocks and bonds are falling together, hitting 60/40 portfolios on both sides.
I wrote about that exact dynamic recently, where normally uncorrelated assets suddenly start moving in the same direction. If you missed that one, I’d recommend going back and giving it a read.

Not to mention, stress in the private credit market has been intensifying.
So, let’s just say the economic situation is less than ideal.

So the official statement said the committee is “attentive to the risks.” The bond market heard something else entirely.
It heard the ingredients of a word that Powell obstinately refuses to use.
🔺 The S-Word
When pressed on the comparison during the Q&A, Powell was direct.
“I reserve stagflation for that, the word, for that period. Maybe that’s just me.”
OK. Let’s take him up on that. Let’s look at that period.
The 1970s stagflation crisis didn’t start with double-digit unemployment and 13% inflation.
No, no. It in fact started with an oil shock.
Interesting.
In October 1973, a conflict in the Middle East led to an OPEC oil embargo against the United States. Oil prices quadrupled in a matter of months. Inflation, which had already been creeping higher, accelerated. The economy, which had already been slowing, tipped into recession.
The Fed was stuck. Sound familiar?
They couldn’t raise rates aggressively because the economy was weakening. They couldn’t cut because inflation was running away from them. So they tried to split the difference. They hesitated. They waited. They hoped the oil shock was temporary.
Yeah, well. It wasn’t.
Then a second oil shock hit in 1979. And this one was triggered by…?
The Iranian Revolution.
History rhymes once again.
And so, inflation became embedded. Expectations shifted. Workers demanded higher wages. Companies passed costs through. The spiral that Powell referenced, the one that drove the Misery Index into the stratosphere, took years to build.
It accumulated.
Let’s be fair though. Powell is right about one thing. We are not in the 1970s. Unemployment is 4.4%, not 10%. Inflation is 2.7%, not 13%. The Misery Index today is a fraction of what Arthur Burns and Paul Volcker faced.
But consider where things stand right now.
An oil shock caused by a military conflict in the Middle East. ✅
A central bank that can’t raise rates without breaking the labor market and can’t cut without fueling inflation. ✅
Five consecutive years of above-target inflation eroding the Fed’s credibility to “look through” anything. ✅
Near-term inflation expectations that have more than doubled in three months. ✅
And a labor market with, in the Fed chair’s own words, “effectively zero net job creation in the private sector.” ✅
Here is what Powell and the Fed are up against:
Powell says he reserves the word stagflation for a much more serious set of circumstances. And I respect the distinction. The 1970s were brutal in ways that are hard to overstate.
But stagflation doesn’t arrive fully formed, of course. It builds, one shock at a time. One missed window at a time. One “we’ll look through it” at a time.
We’re clearly not in the 1970s.
But the question is whether we’re in the early innings of the same game, as this chart seems to suggest.
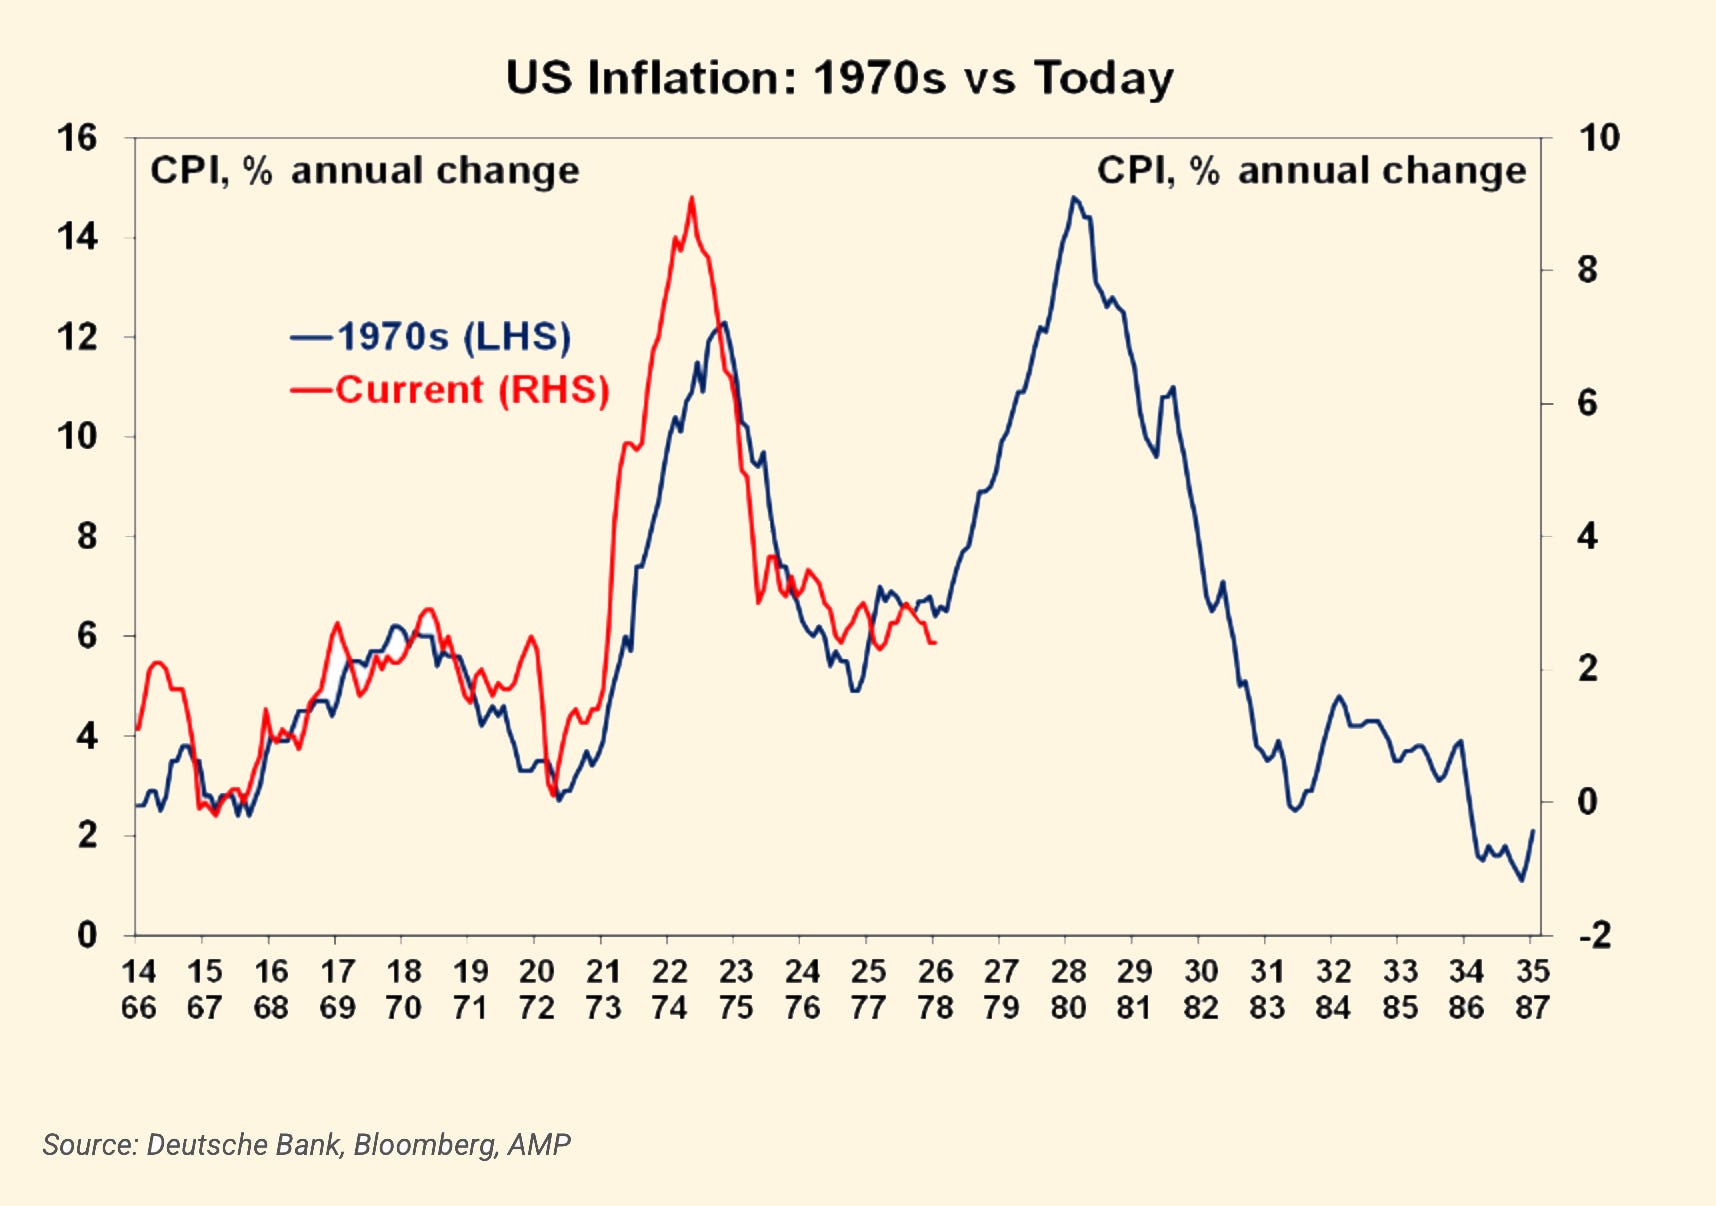
Looks pretty compelling at a glance, and if the bond market is any guide, the answer becomes even harder to dismiss.
Great. Now, what can we do about it?
💰 Where to Go From Here
If this is the environment we’re heading into, and the bond market seems to think it is, then the playbook matters.
So, let’s look at what actually worked the last time around.
During the stagflation era of 1973 to 1982, the S&P 500 returned roughly negative 2.5% per year after inflation (the real return). Long-term government bonds? About the same. Negative 2.5% real return.
If you were in the standard stock-and-bond portfolio, you lost purchasing power for a decade.
That said, two asset classes quietly outperformed.
US small-cap stocks returned about 5.9% per year above inflation during that entire period. And US housing returned about 5.5% above inflation, when you include both price appreciation and rental income.
Some of you may be asking, why small caps?
Well, a few reasons. Let’s look at them.
First, the S&P 500 entered the 1970s heavily concentrated in what was called the Nifty Fifty, a group of large-cap growth stocks with sky-high valuations. When the environment shifted, those stocks got hammered.
Sound familiar again?
If you look at today’s S&P 500, the concentration is arguably even worse. Instead of fifty dominant names, you’ve got seven.
Small caps, by contrast, tend to have more domestic revenue, more pricing power in inflationary environments, and lower valuations. They’re less exposed to the global growth slowdown and more responsive to the local economy.
And this year, the data backs it up. The Russell 2000 is down about 2.5% year to date. The S&P 500? Down nearly 5%. Small-cap value stocks are actually positive on the year. The rotation appears to already be underway.
Housing works for a simpler reason. It’s a real asset that can be used to generate income. Rents rise with inflation and property values tend to hold in real terms. So you can get inflation protection and yield at the same time. Of course, you don’t need to buy a building to get that exposure. Real estate investment trusts, or REITs, offer real asset exposure with the liquidity of a stock.
Now, what about gold?
Gold returned about 3.4% above inflation during the stagflation era. Respectable, but not the top performer. And this past week, watching gold drop nearly 6% in a single session, you might wonder whether it belongs in the conversation at all.
It does. And here’s why.
Gold sold off because the market repriced toward higher interest rates. When yields spike, money moves toward things that pay you to hold them. Gold pays nothing. So in the short term, a rate shock hits gold.
But zoom out.
Every stagflation in history has eventually been resolved the same way. The Fed holds and holds, until something breaks badly enough that they have to act. And when they act, they cut. They ease. They print.
That’s when gold does its best work. During the resolution. When the central bank reaches for the printing press because it has no other choice.
If you believe, as I do, that the Fed will eventually be forced to choose between fighting inflation and preventing a deep recession, and if history is any guide on which one they choose, gold’s long-term case is as strong as it’s ever been. One bad week doesn’t change that math.
And energy equities deserve a mention here too. If oil is the cause of the stagflationary pressure, energy stocks are a direct beneficiary. They profit from the thing causing the pain.
As we have seen these past few weeks.
So the framework I’d think about looks like this:
Places that have historically worked during stagflation:
• Small-cap value stocks (pricing power, domestic revenue, less concentration risk)
• Real assets with yield (housing, REITs, infrastructure)
• Energy equities (direct beneficiaries of higher oil)
• Gold and hard assets (for the eventual monetary response)
• Short-duration bonds or cash (preserve capital while rates are volatile)
Places to be cautious:
• Long-duration bonds (negative 2.5% real per year during 1973-82)
• Mega-cap growth at stretched valuations (concentration risk, the same vulnerability that sank the Nifty Fifty)
• Anything dependent on cheap financing
As for now, the economy is still functioning. The banking system is stronger than 2008. Powell may turn out to be right that this is just “tension” and not a full-blown crisis.
But the signals are real. The data is moving in the wrong direction. And the Fed, in its own words, is in a difficult situation.
And then there’s Bitcoin.
Bitcoin didn’t exist during the 1970s, so we have no stagflation track record to point to. But we do know this: Bitcoin has a fixed supply. No central bank can print more of it. No committee can vote to expand it. No emergency meeting can conjure it into existence.
If the stagflation playbook ends the way it always has, with the Fed eventually blinking and reaching for the printing press, then an asset with a hard cap of 21 million units and no central point of failure starts to make a whole lot of sense.
Gold has been the traditional answer to currency debasement for thousands of years. Bitcoin is the new one. And in an environment where the Fed is trapped, the bond market is repricing, and inflation expectations are becoming unmoored, sophisticated investors begin to overweight assets that can’t be debased.
Because when the Chairman of the Fed tells you the situation is difficult, it might be worth taking him at his word.
🔎 What I’m Watching This Week
📌 The Number: 5.38%. That’s the 1-year breakeven inflation rate as of this week. In December it was 2.23%. If this doesn’t start pulling back, Powell’s “well anchored” framework is failing by his own measure. (Bloomberg, USGGBE01 Index)
📌 The 2-year yield. It touched 3.96% intraday Thursday. If it holds above 3.75%, the market is telling you rate cuts are dead for 2026.
📌 Oil. Brent at $119 and WTI above $100. Two more weeks here and second-round effects hit everything from airline tickets to groceries.
📌 Fed speak. Multiple FOMC members scheduled next week. Listen for who echoes Powell’s “tension” framing and who starts breaking ranks.
📌 Private credit gates. Fund redemption windows are approaching quarter-end. If more gates close, the stress we covered in Issue #209 accelerates.
That’s it. I hope you feel a little bit smarter knowing what the Fed said, what the bond market heard, and how to think about positioning your portfolio if the S-word turns out to be more than just a 1970s relic.
If you want this kind of deep-dive analysis every single week, not just once a month, join the paid Informationist family right here:
And if you enjoyed this free version of The Informationist and found it helpful, please share it with someone who you think will love it, too!
Talk soon,
James✌️
───
Join 1,583 premium subscription readers who get the full breakdown every Sunday
Great article, James. I actually thought gold did better in the 1970s than you outlined. But AI confirmed your numbers for me.
It pointed out that gold’s performance came in short bursts. It wasn’t a smooth line up. I guess that makes sense in very uncertain times.
J.
A superb articulation of a Genuine S—t Show.
One thing I think you missed off is the $39 Trillion Deficit vs the early 70’s…the interest rate hike is a Hemlock Cocktail for US and….Oh Yeah…And there’s also that “Spot of Bother “ going on not too far from the Paradise of Dubai.
Last Thing: is there a simple way to track the TIPs Spread??
Thanks & Respect for what You do!
👊🙏