
The Fed Dot Plot: Rate Trajectory or Reading Tea Leaves?
Issue 82 (Repost from CK Archive )

✌️ Welcome to the latest issue of The Informationist, the newsletter that makes you smarter in just a few minutes each week.
🙌 The Informationist takes one current event or complicated concept and simplifies it for you in bullet points and easy to understand text.
🧠 Sound smart? Feed your brain with weekly issues sent directly to your inbox:
Today's Bullets:
The Dots
Fed's Latest Plot
Fed's Track Record
Reading Tea Leaves
Inspirational Tweet:

Ah yes, Fed Day was last Wednesday, and with it brought plenty of speculation, anxiety, and further clouded answers.
One of those poorly defined answers, seemingly sharp, but gets more pixelated and undefined the closer you look, is the release of the Fed's own Dot Plot.
But what exactly is the Dot Plot, and is it an accurate prediction of future Fed Funds rates, one that you can trust? Is Sven Henrich (@NorthmanTrader) right, in the Tweet (er...Xeet) above?
Well, we've talked about Fed Dots before, but it's worth a refresh today, an examination of the latest Plot. A look back under the hood, so to speak, Because as we near a Fed pauseand then pivot, everyone is looking for clues from the Fed itself.
If this all sounds foreign to you, or if you've never heard of or seen the Fed Dot Plot before, then have no fear.
Because we're going to unpack it all, nice and easy as always, today.
So, grab a cup of coffee and settle in for a good ol' Fed Tea Leave and Tarot Card reading this morning with the ALL NEW (but mostly the same) Informationist.
🟡 The Dots
Before the Great Financial Crisis of 2008, the Federal Reserve (affectionately referred to as just The Fed around here 🙄) mostly kept policy tight to their chest and acted as they saw fit, then reported their actions and reasons to the public afterwards.
This changed after The GFC, though, and in 2012, the Fed introduced what is known as the FOMC Dot Plot. This plot shows where each of the 12 members of the FOMC (yes, the part-time economists and full-time gaslighters setting policy within the Fed) expect the Fed Funds Rate to be in the future.
*A Hefty Note of Caution: The Fed is not bound by these predictions, and they seem to change their dots more often than Elon changes the Twitter (er...X) algorithm.
But let’s take a peek at the latest plot and familiarize ourselves with the concept.
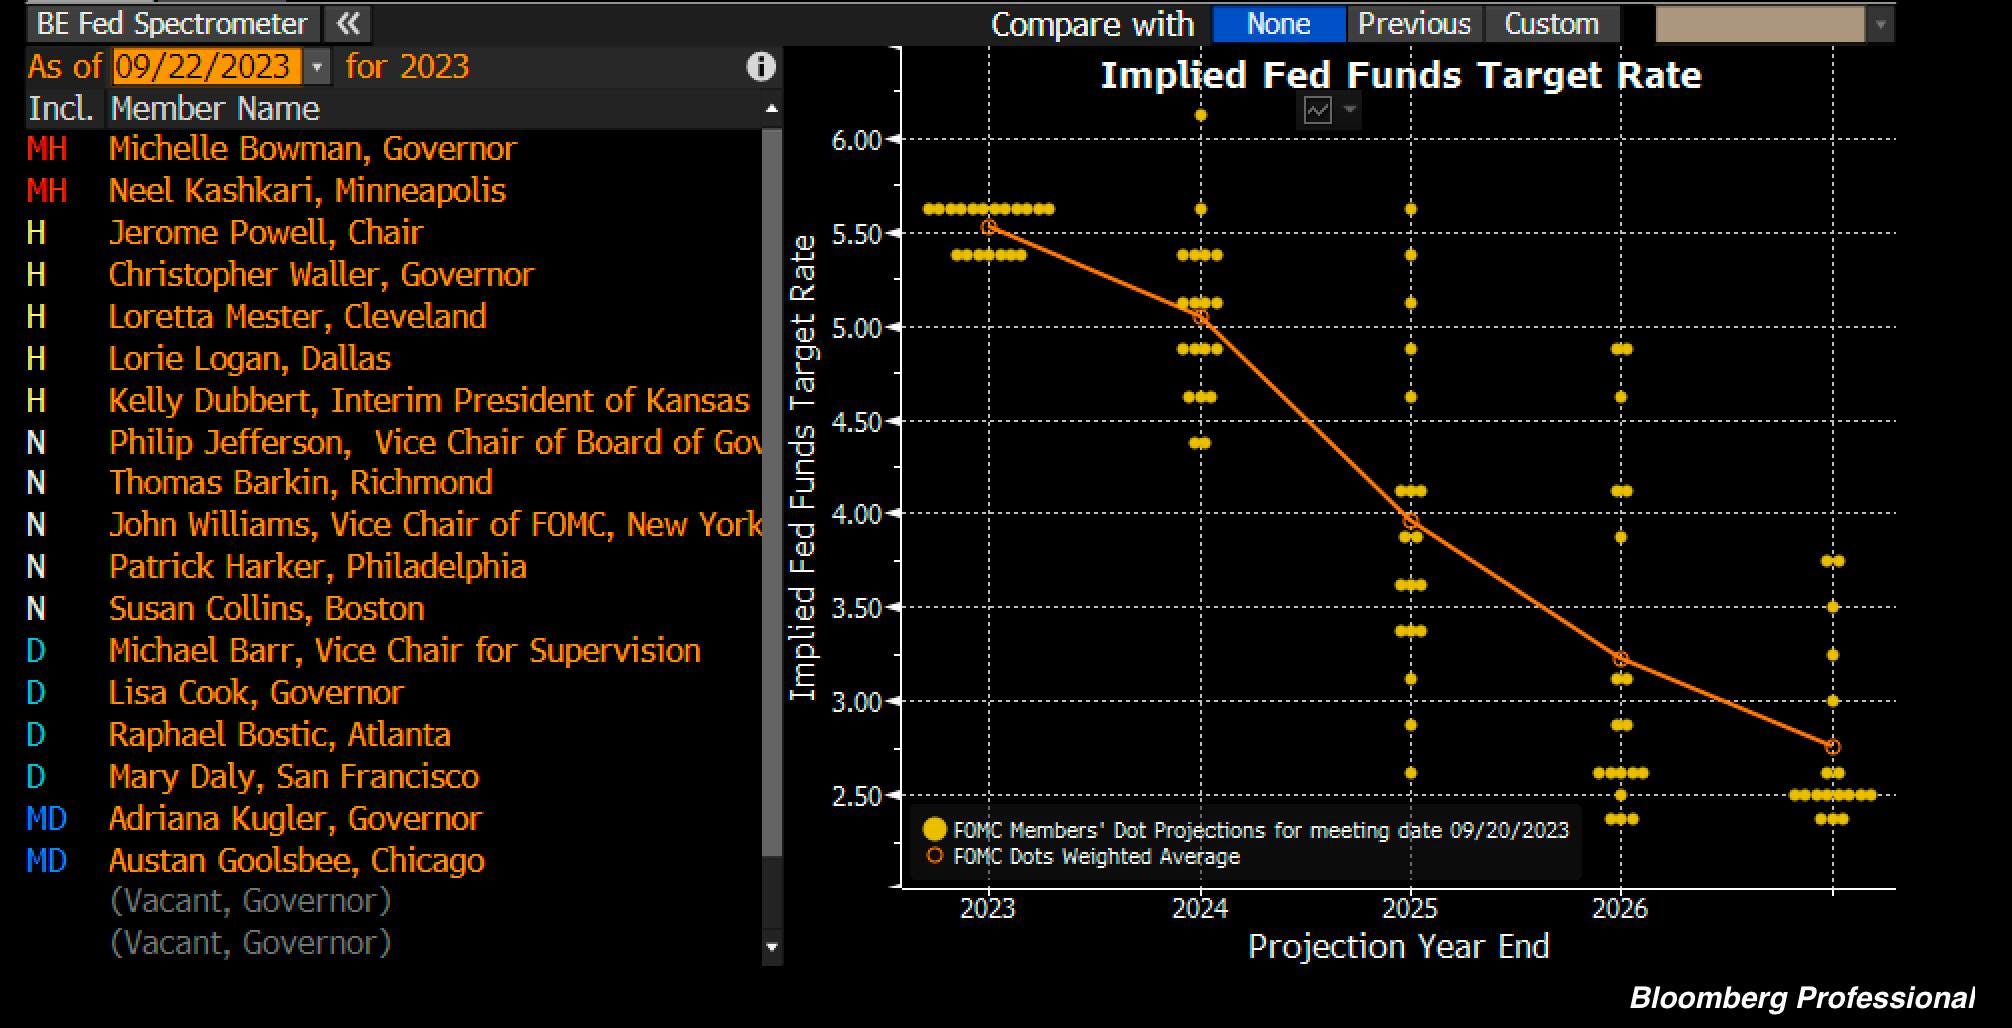
What we are looking at here is the list of all of the current members of the FOMC on the left. A few notes:
Only eight members have permanent votes, and the rest rotate for the last four votes, to total twelve votes at each meeting.
And so, the nineteen Dots are not votes, but rather the projections of where each of the members expects rates to be in the future. This explains why there are more dots than votes that will actually take place.
Finally, do you see the handy little key on the left? MH, H, N, D and MD? These stand for Most Hawkish, Hawkish, Neutral, Dovish, and Most Dovish.
And the chart itself shows the estimated rate that each member thinks Fed Funds will be at the end of each year in the future, out to what appears to be 2027, but it is not labeled, as it stands for Longer Term.
Whatever that means.
OK great, but what about the Dots themselves?
📈 Fed's Latest Plot
First, to be clear, remember that the Fed establishes a range for the Fed Funds Rate, which includes an Upper Bound and a Lower Bound. Currently, that range is 5.25% to 5.5%, giving us a midpoint rate of 5.375%.
This is what we will be quoting today, the midpoint of the range.
Looking at the end of 2023 on the above Dot Plot, the weighted average estimate of the Fed Fund Rate from Fed members is 5.53%, with seven members estimating no change from the current 5.375% (average) rate and twelve members estimating the rate at the end of the year will be 5.625%.
Translated: seven members think there will be no more rate raises and twelve believe there will be one more 25bp rate hike by year end.
Looking out to the end of 2024, the picture starts to get cloudy. Actually, it literally becomes pixelated, with seven different rate projections, none with more than four members in agreement.
This gives us an average of 5.046% at year end. So, the average member expects rates to go down. One member expects rates to be at 6.125% (three more 25bp rate hikes?), and two members expect rates to end at 4.375, down 1% from today.
That's about the most we can gleam from that.
Let's peek at 2025, shall we?
Good God.
Twelve different projections between nineteen estimates.
FFS.
Do these people even talk to each other? Or do they just blindfold one another and throw the proverbial dart at a blank wall?
I mean, we have one 5.625%. one 5.375%, one 5.125%, one 4.875%, one 4.625%, and on the other end, we have a 3.125%, a 2.875%, and a 2.625% estimate.
That's a delta of 3 full percent from the high to the low. Or TWELVE quarter-point increments.
2026 is marginally better on the agreement, but not much. And in the Longer Term column, let's just say that if rates remain above 3.5% for years, then interest expense would likely be the largest single line item on the US Treasury's budget, even bigger than Social Security.
God help us.
Think anyone at the Treasury has read my piece about the Debt Spiral yet? If you know anyone at the US Treasury, go ahead and forward them a copy, please. And if you are wondering what I'm talking about, it's this:

TL;DR: If the US government was a company on the stock exchange, it would be called a zombie company, one that cannot cover its interest expense with its revenues.
Moving on.
Let's see just how accurate The Fed members are when predicting the next year of rates, at least, shall we?
I mean, it's just one year out, and they have a plethora of data to see exactly where the economy is headed and how tight or loose, policy should be, right?
Right?
🤨 Fed's Track Record
Let's first jump into our nifty Bloomberg-driven Time Machine and see what the Fed was thinking back in 2021, shall we?

On December 15th, 2021, the Fed releases this Dot Plot:
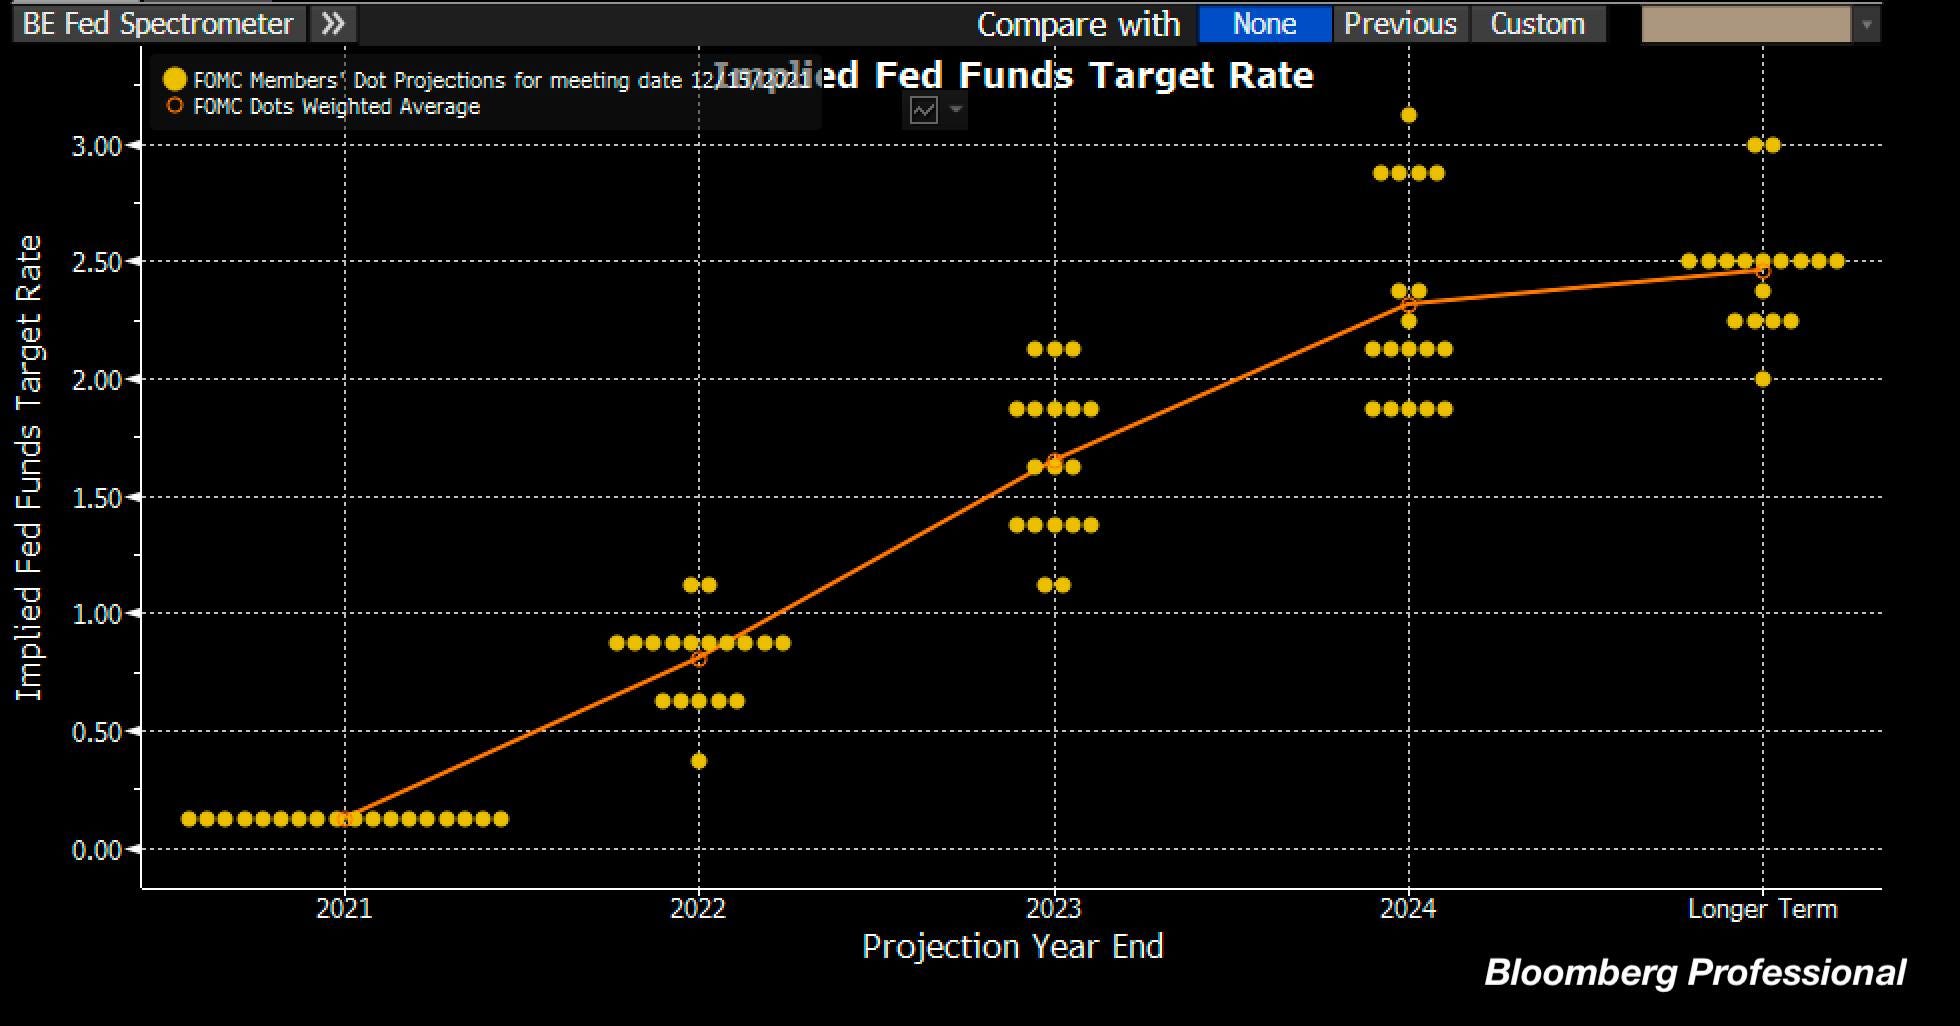
Let's just zero in on 2022, projections, shall we?
The members seemed pretty well in agreement that rates would be in the .5% to 1% range, settling in on a weighted average of .806%.
How'd they do?
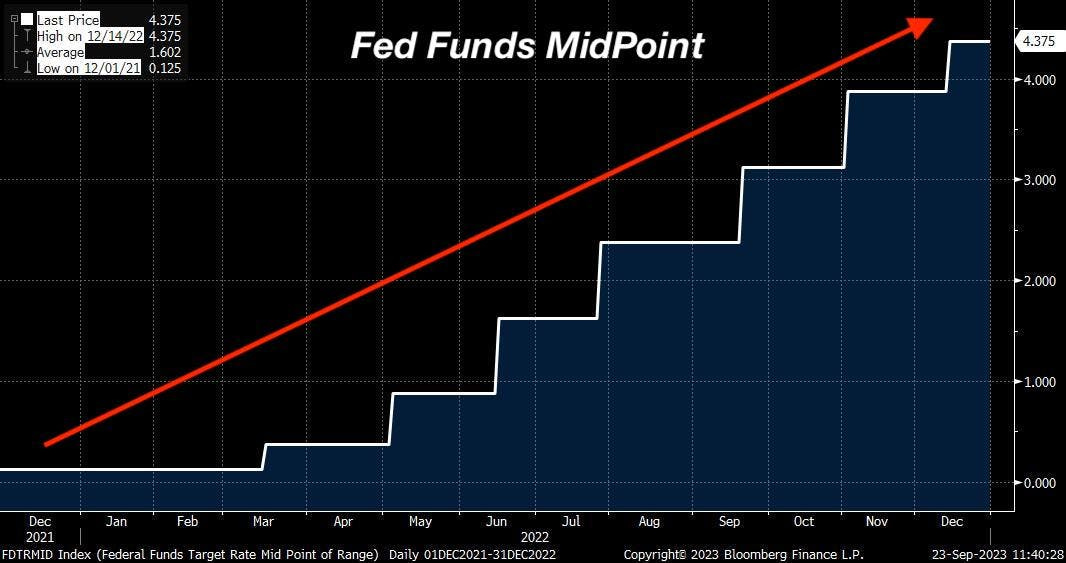
kinda' like...

"My bad," says Mary Daly.
Actually she didn't say that. She didn't say a word. None of them did.
Why?
No accountability, means no explanation.
OK, maybe it was a one-off. Surely six months later, when we were in the heart of raging inflation and full swing of the tightening cycle they would get it right.
Surely.
Let's see.
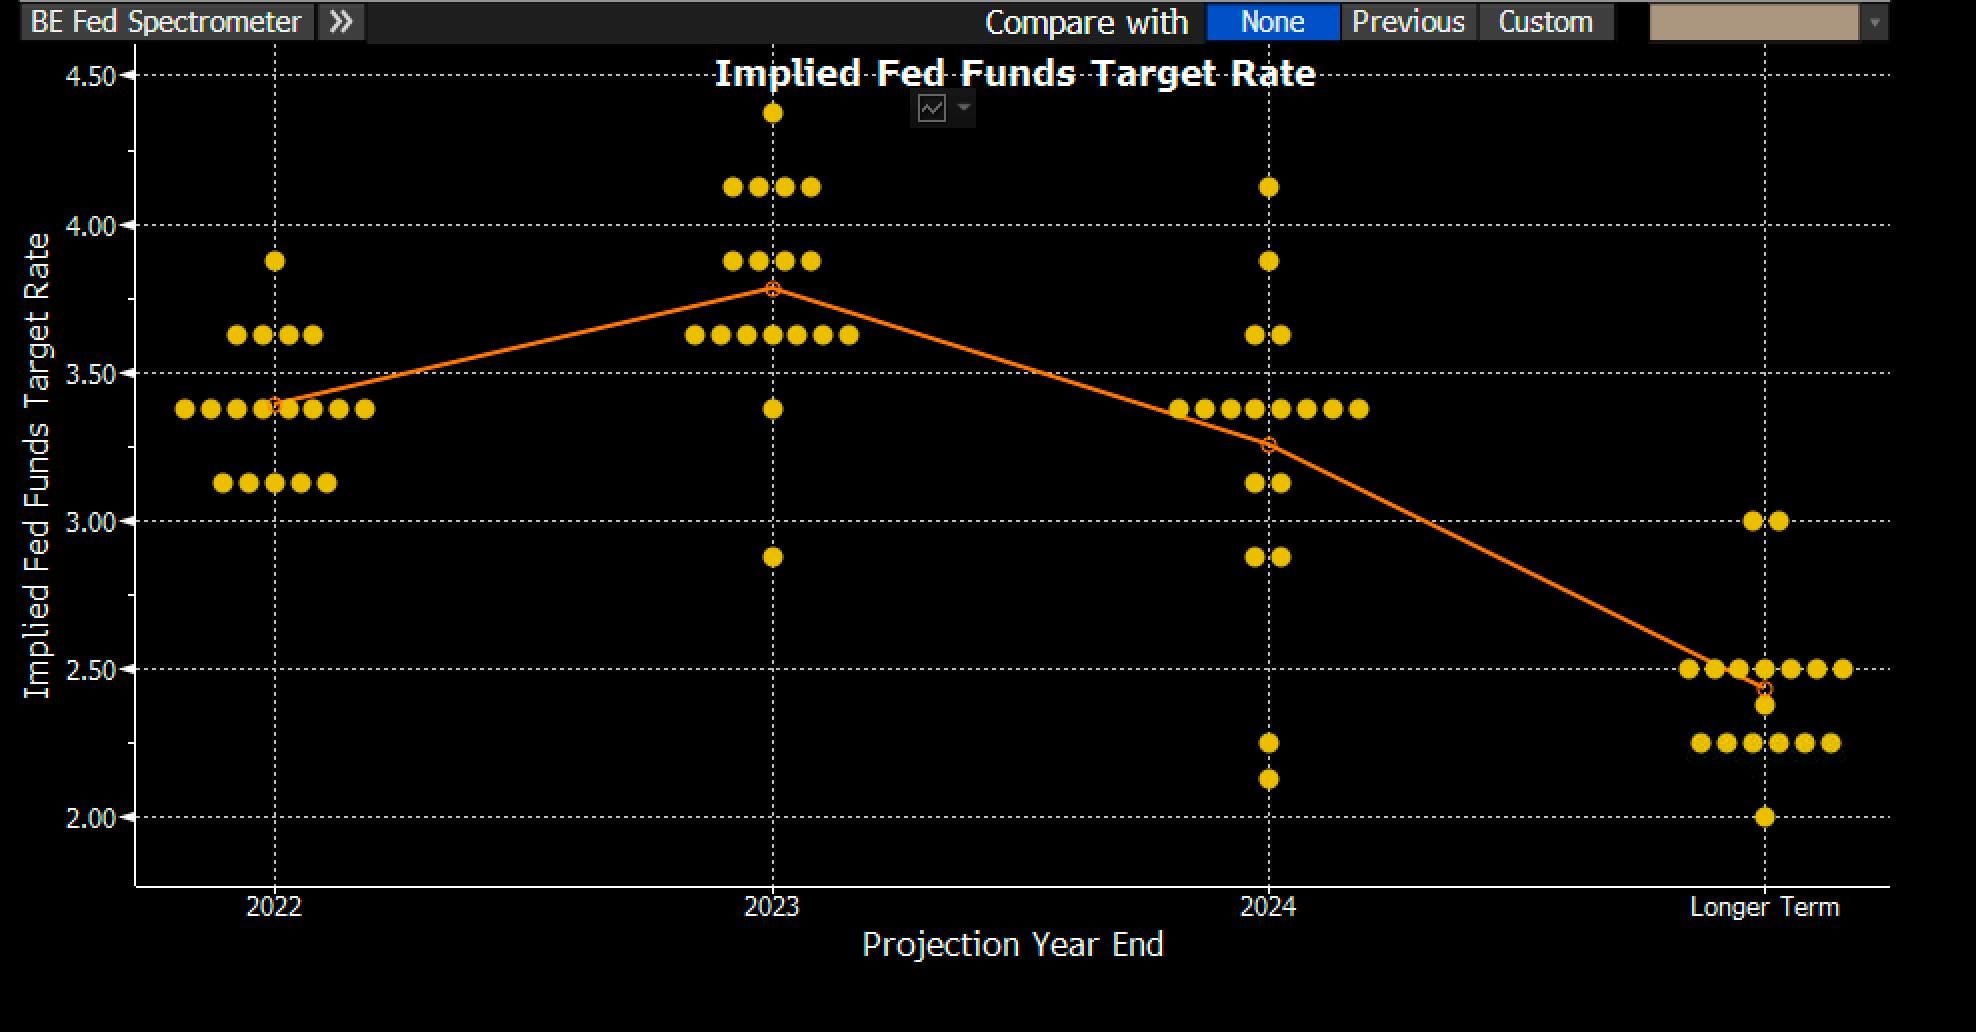
Nope.
Estimated end of 2023 rate? 3.625%.
Actual rate? Highly likely to be nearly TWO FULL PERCENTAGE POINTS above that.
Seriously, people.
😵💫 Reading Tea Leaves
So, where does this leave us?
Pun intended, yes.
Unfortunately, it leaves us with greatest tea leaf reading ceremony of all.
Watching and listening to the Fed Pressers, where Chairman Powell stands at a podium while waxing poetic on the challenges of fighting inflation and evidence that their policies are working.
Unless, of course, we take everything that Powell says with a grain (read: bucket) of salt, and look at the actual data behind economic activity and estimate forward rates accordingly.
This is what credit analysts and bond investors do.
This is why the yield curve is inverted, and has been for a while.
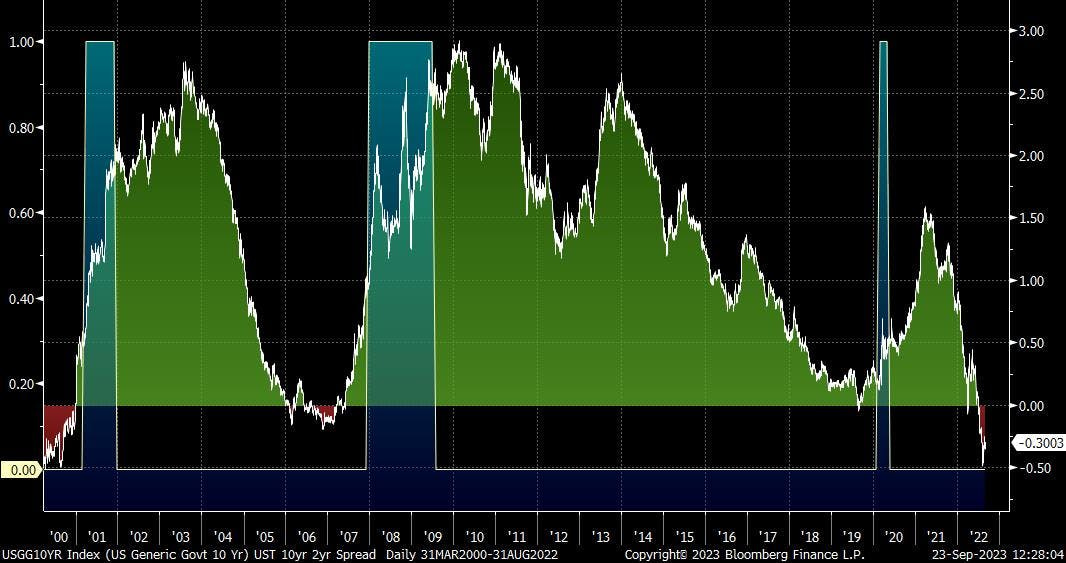
For those wondering what the above chart means, it is just showing that the 10yr US Treasury has a lower yield than the 2yr US Treasury, meaning that investors expect a recession in the near future and rates to come down accordingly.
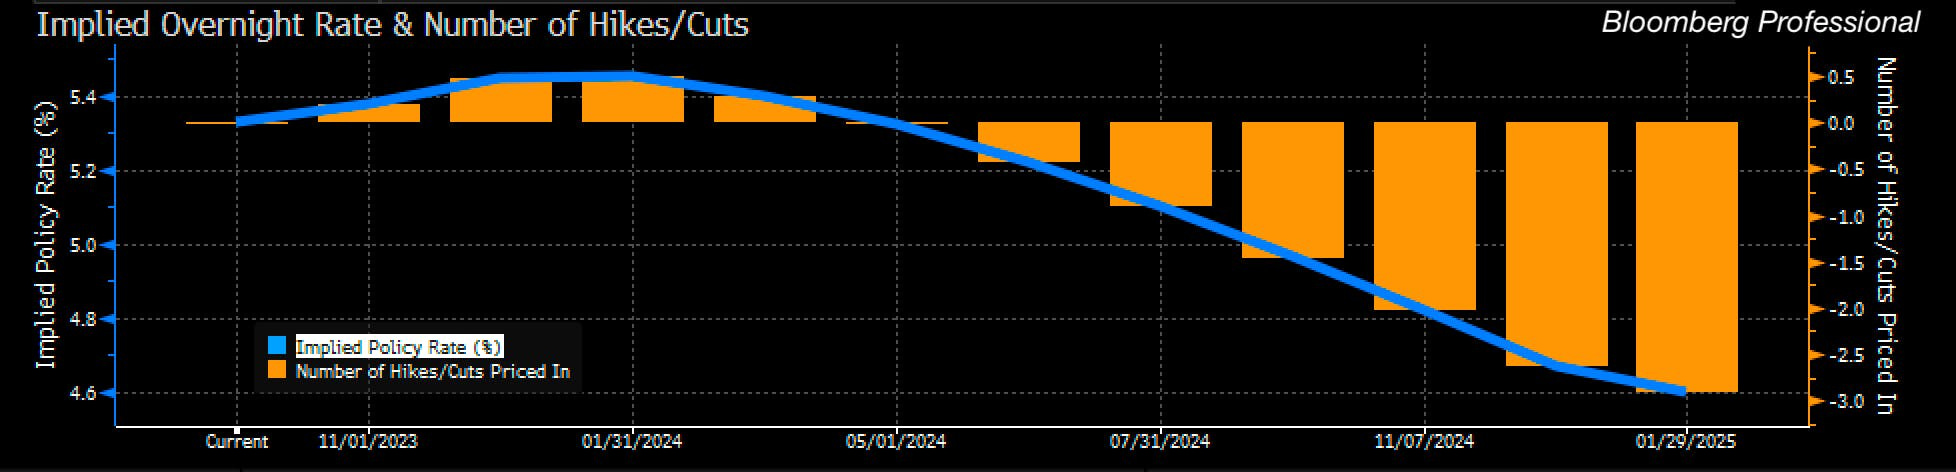
This is also why the Fed Fund Futures are nearly half a percent below the latest Dot Plot for the end of 2024, estimating a 4.625% rate versus the Fed's own estimate of 5.046% (and one dimwit up at 6.125%🥸).
These are the kinds of things I am watching. And I'm also using a little common sense.
After all, you can't do this to rates:
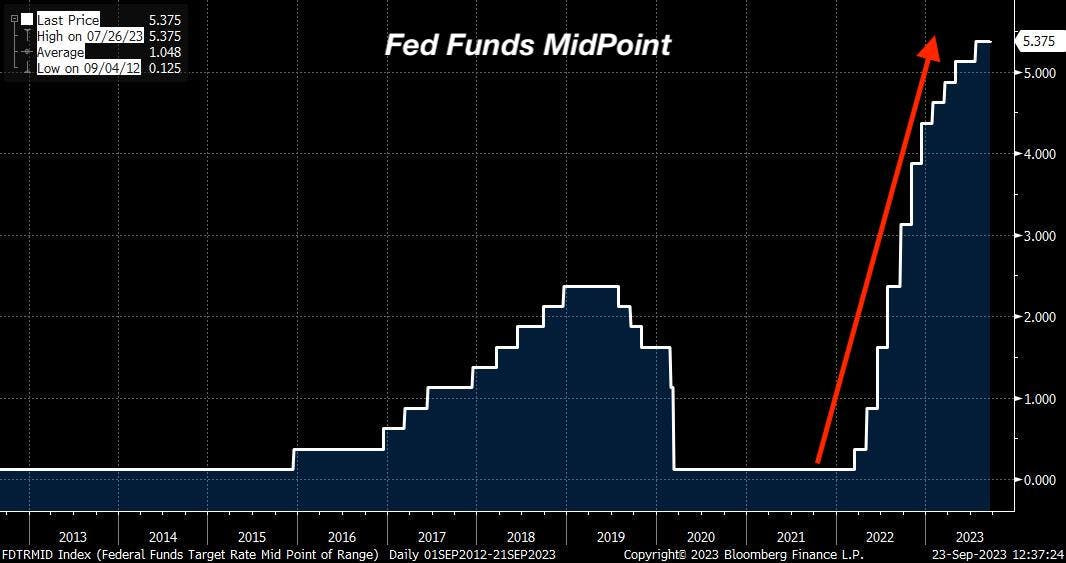
And expect a 'soft landing'.
No, as many of you know, I am personally on the vigilant lookout for what we call a credit event. Something that breaks in the credit market, something big enough, that extends out and affects the Treasury market. Something that has contagion. The threat to take down multiple large institutions and possibly lock up the Treasury market itself.
Because when that happens, you will see all these projections and estimates and futures thrown right out the window, along with the absolutely disposable words that come from the Fed members themselves. 🤮
And that, my friends, is the ride that I'm buckling in for.
So, I sincerely suggest you get your portfolios in order, your exposures under control, and your ability to take advantage of large drawdowns in place.
Either way, keep your head on a swivel and be aware. That is exactly what I am doing.
That’s it. I hope you feel a little bit smarter knowing about Fed Dot Plots and are ready to start incorporating the ideas above in your own investment strategy.
Talk soon,
James✌️