
💡Should We Be Worried About Credit Spreads?
Issue 180

✌️ Welcome to the latest issue of The Informationist, the newsletter that makes you smarter in just a few minutes each week.
🙌 The Informationist takes one current event or complicated concept and simplifies it for you in bullet points and easy to understand text.
🫶 If this email was forwarded to you, then you have awesome friends, click below to join!
👉 And you can always check out the archives to read more of The Informationist.
Today’s Bullets:
What are credit spreads?
Why are they significant?
What do today's spreads suggest?
What happens to markets when spreads explode?
Inspirational Tweet:
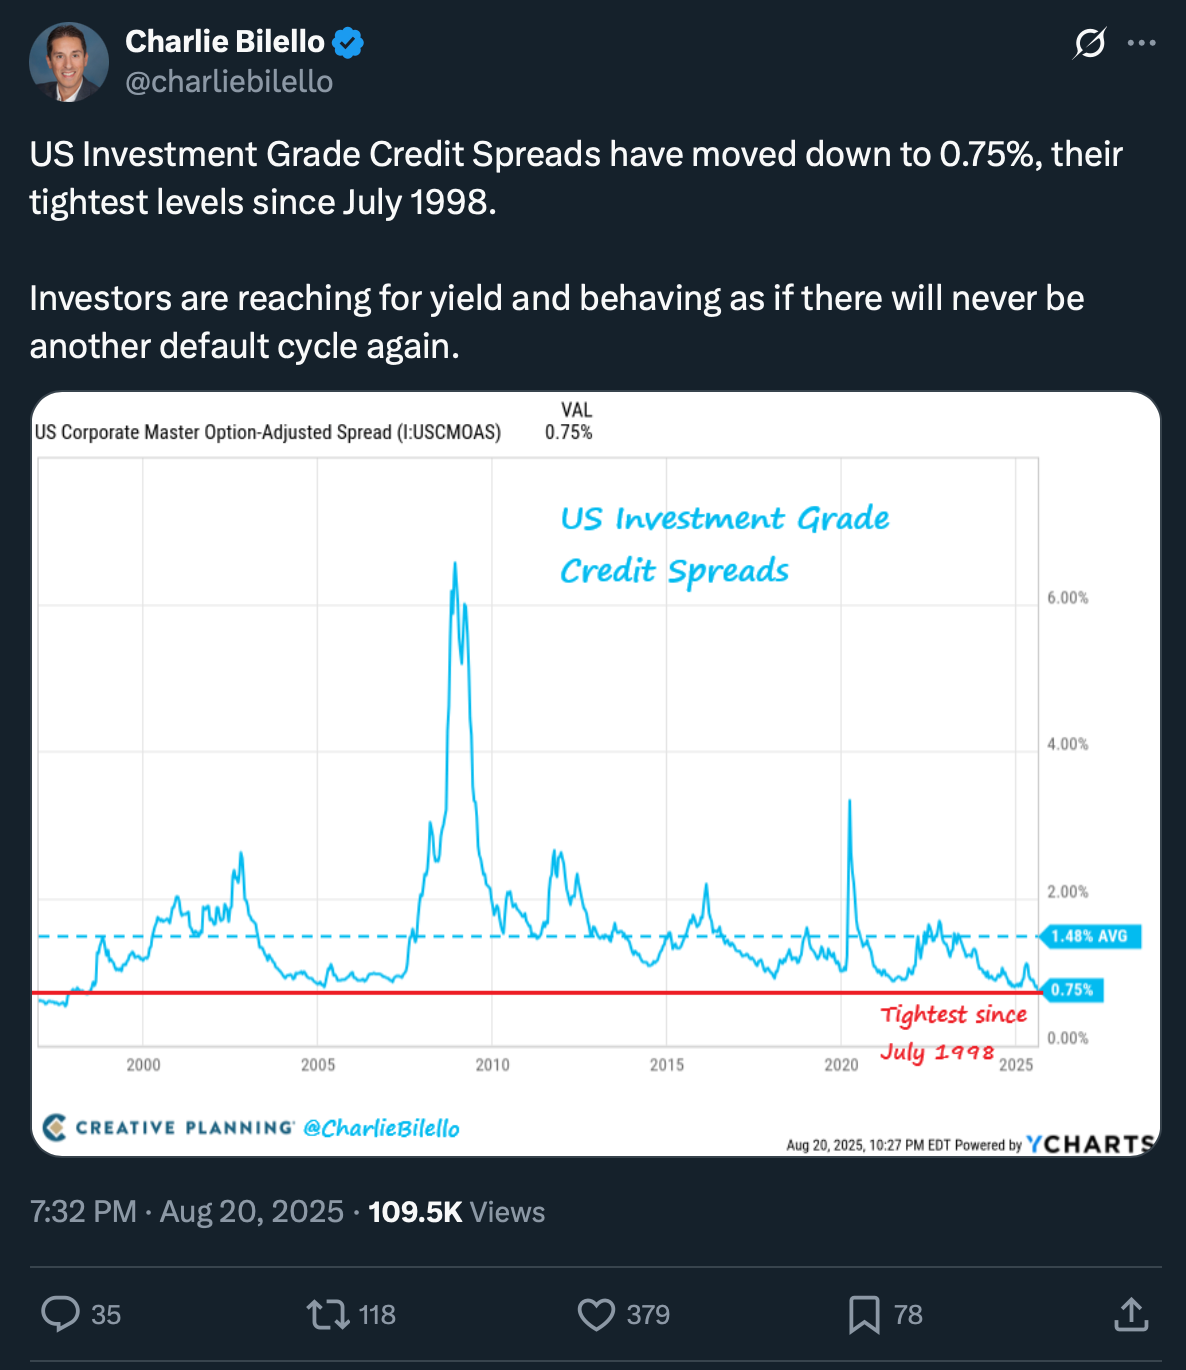
"Investors are reaching for yield and behaving as if there will never be another default cycle again."
Nailed it, Charlie.
That’s right. With credit spreads at 0.75%—the tightest in 27 years—this chart should make you stop for a moment. Reassess the situation.
After all, the last time we saw spreads this compressed was July 1998, and anyone who remembers what came next probably just got a little queasy.
Because if there's one thing markets teach us repeatedly, it's that when everyone's comfortable, that's precisely when you should start paying attention.
And if this has you wondering what we are talking about here and what may happen next, have no fear. Because we are going to get you all sorted out—nice and easy, as always—here today.
So grab a big cup of coffee and settle deep into your favorite seat, as we unpack an important corner of the credit world with this Sunday’s Informationist.
Upcoming Event
Before we start, a quick announcement of an appearance I’ll be making next week. It’s free, and I expect it to be full of signal!

Three years ago, the signs were subtle. Now, the ground is shaking.
AI is reshaping jobs right now. Cryptocurrency is embraced by banks and embedded in retirement law. Commodities are surging into a supercycle redefining global wealth.
On August 27th, Jefferson Financial is sponsoring an event that will connect the dots — showing you how these forces fit together and what they mean for your portfolio, your income, and your family’s future.
🤓 What are credit spreads?
Think of credit spreads as the market's lie detector test for corporate debt.
When a company wants to borrow money by issuing bonds, investors demand extra compensation above what they'd get from (so-called) "risk-free" US Treasury bonds. That extra yield is the credit spread.
In other words, it is essentially the market's assessment of how likely that company is to pay you back.
Here's how it works:
10-year Treasury yield: 4.20%
10-year Apple corporate bond: 4.60%
Credit spread: 0.40% (40 basis points)
That 40 basis points (.40%) represents the premium investors demand to lend to Apple instead of the US government. The lower the spread, the more confident investors are in Apple's ability to repay both the interest and the debt.
What we are looking at here is the highest rated debt, aka investment grade debt.
Now you may be asking, Why Investment Grade? Why not High-Yield Debt? I mean, isn’t that more likely to default and give us a clearer picture of pending doom?
This is a good question: investment-grade spreads (what we're looking at) tell a completely different story than high-yield spreads.
Investment-Grade (BBB- and above): These are supposedly the "safe" corporate bonds. When IG spreads are tight, it means investors think even mediocre companies are rock solid. The message: "Nobody's going bankrupt any time soon."
High-Yield (BB+ and below): These "junk bonds" are already expected to be risky. When HY spreads tighten, it often just means investors are getting paid adequately for known risks.
Incidentally, if you are wondering what all these letters mean, I wrote all about credit ratings a while ago (when the US Treasuries were downgraded from AAA by the last agency), and you can find that newsletter here:

Bottom line for today: When IG spreads hit 0.75%, the market is essentially saying that even borderline investment-grade companies (those BBB- credits teetering on junk status) are as safe as houses. That's either incredibly good news or remarkably naive behavior.
Take a look at this 30-year history of investment-grade credit spreads.
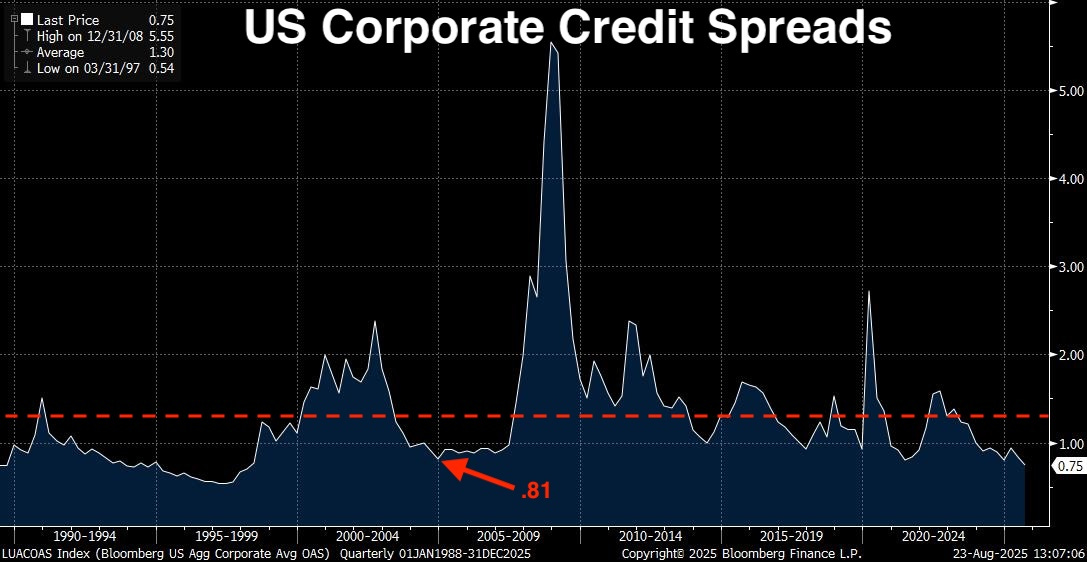
And look at where we are today—0.75%. Compare that to the towering spike of 5.55% during the 2008 financial crisis.
But here's the elephant in the room that should terrify everyone: Look closely at 2006-2007, right before the Global Financial Crisis.
Even at the peak of housing bubble euphoria—when banks were handing out NINJA loans (i.e., No Income, No Job, and No Assets 😱), when everyone believed real estate only went up, when complacency was arguably at an all-time high—credit spreads never got below .81%.
We are currently tighter than we were before the worst financial crisis in 80 years.
Uh, Houston?
Let’s think about that for a moment. In 2007, when investors were so comfortable, when risk management was a four-letter word, when "subprime is contained" was the rallying cry—even then, the market demanded almost 100 basis points to lend to corporate America.
Today? Just 75 basis points. We've achieved a level of complacency that makes 2007 look prudent.
That red dashed line shows the 30-year average of 1.30%—and today, we’re sitting 55 basis points beneath it as if 0.75% is perfectly normal.
We've only been this low once before: March 1997, when spreads hit 0.54%. And we all remember how that late-90s euphoria ended.
What Happened After 1998? A Masterclass in Unintended Consequences
Since we're comparing today to 1998, let's talk about what actually unfolded after those historically tight spreads.
The late 1990s felt unstoppable. The internet was revolutionizing everything, corporate profits were soaring, and credit was flowing like, well…water. Sound familiar?
And the cracks started small:
July 1997: The Asian Financial Crisis began when Thailand devalued the baht. Credit spreads in Asia exploded, but US spreads stayed tight. "It's contained," everyone said.
August 1998: Long-Term Capital Management (LTCM)—the infamous hedge fund run by Nobel Prize winners—imploded. Their strategy assumed credit spreads would stay stable. When Russian bonds defaulted and global spreads exploded, LTCM's $125 billion portfolio nearly took down the entire financial system.
September 1998: The Fed cut rates to prevent contagion, but the damage was done. Companies that had gorged on cheap credit suddenly faced a drought.
March 2000: The dot-com bubble burst. Companies with no profits and massive debt loads—companies that could only exist in a tight-spread world—vanished overnight.
2001-2002: Recession. Corporate defaults spiked. Credit spreads that had been 0.54% hit 3%+.
The pattern? Tight spreads enabled excessive risk-taking. When something finally broke (Asian crisis, LTCM, tech bubble), the unwinding was brutal.
The most dangerous part? Each crisis felt like an isolated event, but they were all connected by the same cheap credit that made risky behavior seem reasonable.
When spreads are wide (say, 3-4%), investors are wary, nervous. They're demanding higher premiums because they see default risk all over the place. When spreads are tight (like today), investors are essentially saying, "We're not worried about anyone defaulting. Corporate America is rock solid."

But here's the thing about markets: when everyone agrees on something, that's usually when you should start asking some hard questions.
🤔 Why are they significant?
Credit spreads are like the canary in the coal mine for the entire financial system. They don't just tell us about corporate debt—they reveal the general market's appetite for risk.
Think of spreads as a fear gauge with three settings:
Wide Spreads (High Fear): Investors demand big premiums because they anticipate trouble ahead. Credit becomes expensive, companies cut back on expansion, hiring slows, and economic growth stalls. It's a self-reinforcing cycle of caution.
Moderate Spreads (Goldilocks): Just enough concern to keep discipline in the system, but not so much that it chokes off growth. This is where healthy markets typically live—maybe 1.5-2.5% for investment-grade bonds.
Tight Spreads (Complacency): Everyone's comfortable. Money is cheap, companies can borrow easily, and risk-taking flourishes. Sounds like a great environment, right? Except historically, this is when bubbles form and systemic risks build.
The spread-to-recession connection is pretty darned consistent.
Look at any major economic downturn over the past 30 years, and you'll find the same pattern: spreads start tight (overconfidence), something breaks, spreads explode (panic), and the real economy follows.
Look here.
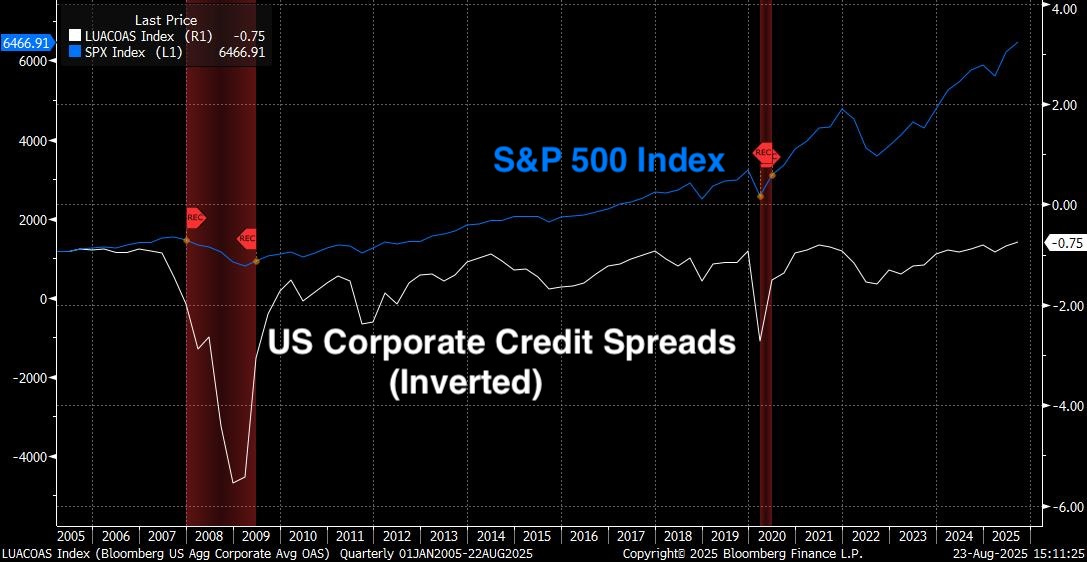
The blue line is the S&P 500, currently sitting pretty at 6,466. The white line is credit spreads—but flipped upside down so you can see the relationship clearly.
Notice how perfectly they move together? When spreads compress (white line goes up), stocks soar. When spreads widen (white line falls), stocks crater. It's almost mathematical in its precision.
Look at 2008: spreads exploded to over 5% and the S&P collapsed to around 700. Fast forward to today: spreads at historic lows, stocks at all-time highs. The correlation is so tight it's almost eerie.
Why?
Because credit has become the lifeblood of modern capital markets. When it's flowing freely and cheaply, everything seems possible. When it suddenly becomes expensive or unavailable, the music stops and many people end up without a chair to sit on.
Today's 0.75% spread isn't just a number—it's a statement. The market is saying corporate defaults are virtually impossible, the economy is bulletproof, and nothing bad will happen to anyone, anywhere, anytime soon.
A little bit more on that.
🤨 What do today's spreads suggest?
In essence, the market saying: "Risk? What risk?"
Take a peek at this beauty.
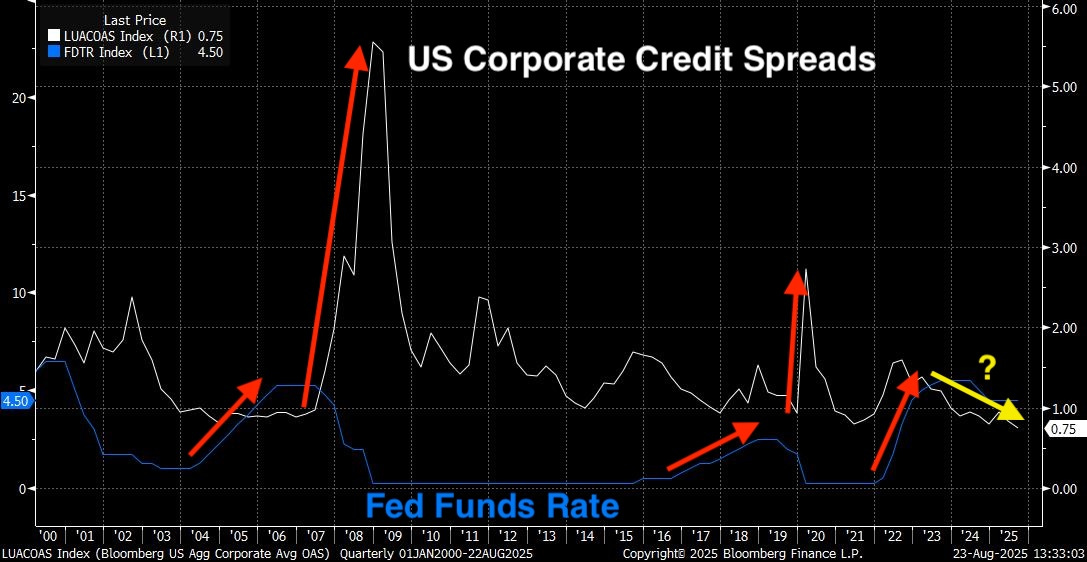
This chart shows credit spreads (white line) versus the Fed Funds Rate (blue line). Notice those red arrows pointing to previous Fed hikes and spreads exploding higher soon after. Each time, spreads went from complacency to crisis almost overnight.
So, what's different this time? Fed Funds Rate is sitting at 4.50%—the highest in years—yet credit spreads are still compressed at historic lows.
During most periods of higher Fed rates, spreads are typically wider as investors demand more compensation for lending into a restrictive monetary policy. Yet today, with the Fed still in restrictive mode, investors continue to pile into corporate debt like it's free money.
That yellow question mark? That's the big question facing markets right now
According to today's credit markets, lending to corporate America right now is less risky than it was during the entire housing boom, the tech recovery, the post-9/11 period, and basically every other moment in recent history except for a brief window in 1997-1998.
Either we've achieved some kind of economic nirvana, or something's off.
I can think of a few reasons spreads are tight, like:
Strong Corporate Balance Sheets: Many companies used the pandemic to refinance debt at ultra-low rates and build cash cushions.
Fed Put Psychology: Investors believe the Fed will always step in to prevent systemic credit events.
Search for Yield: Even with Fed rates at 4.50%, institutional investors are still reaching for yield, driving bond prices up and spreads down.
AI-Driven Economic Optimism: Markets have been pricing in an expected productivity boom that makes current corporate earnings and balance sheets look conservative.
But here's what worries seasoned credit investors: tight spreads create the very conditions that eventually blow them up.
The Hidden Reality of Corporate Balance Sheets
Let's dig deeper into those "strong corporate balance sheets" everyone keeps talking about, because the reality is more complex than the headlines suggest.
The Good News: Many S&P 500 companies did indeed use the pandemic to refinance debt at rock-bottom rates. Apple has $162 billion in cash. Microsoft's balance sheet is fortress-like. These companies could easily survive a credit freeze.
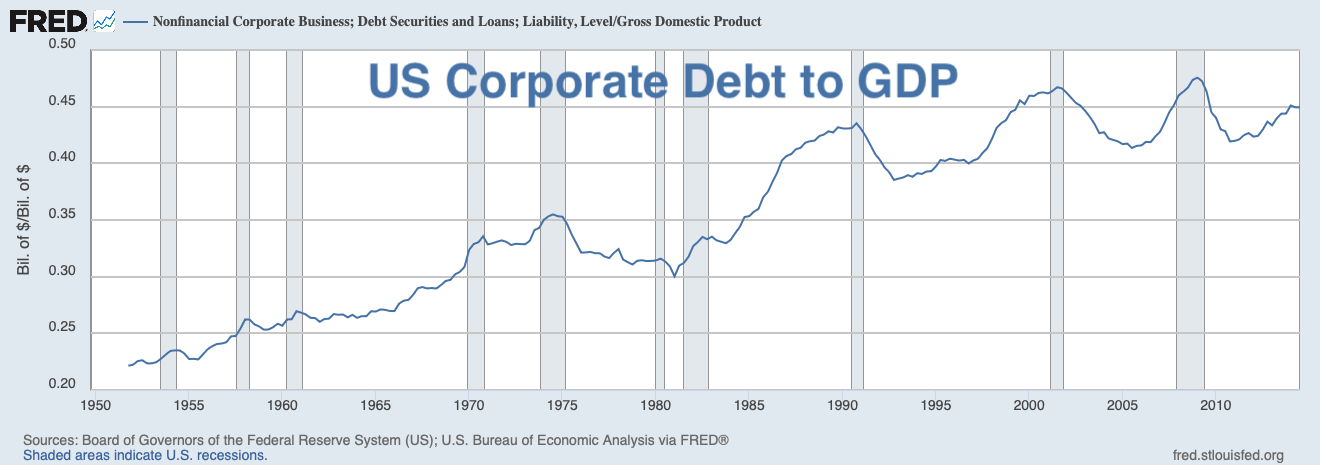
The Not-So-Good News: The median company tells a different story. According to Fed's data, corporate debt-to-GDP is near all-time highs at 45%. About where it was just before the 2008 crisis.
The Ugly Truth: Much of this debt is floating rate or short-term. When credit spreads widen, these companies don't just face higher borrowing costs on new debt—much of their existing debt gets more expensive too.
One more thing…about private credit.
Since 2008, an estimated $1.5 trillion has flowed into private credit markets—direct lending by non-bank institutions. These loans typically carry floating rates and looser covenants (requirements for companies to stay compliant) than traditional bank loans.
Why does this matter? Private credit doesn't show up in traditional credit spread measures like our LUACOAS index above. It's the shadow banking system on steroids, and it's largely invisible until something breaks.
Translation: Our credit spread measures may be showing a false sense of security. They're tracking the "good" corporate credit—the stuff banks and institutions are comfortable owning. The risky stuff is hidden in private markets, waiting to explode when spreads widen and refinancing becomes impossible.
Many of us have seen this movie before.
When money is cheap and easy to access, companies lever up. They make acquisitions they shouldn't make, invest in projects with questionable returns, and generally take risks they'd never consider during tougher credit conditions.
And so, lenders get sloppy. Covenant standards deteriorate. Due diligence gets rushed. Everyone assumes the good times will continue.
A kind of Bill and Ted syndrome.
And so, the tighter spreads get, the more systemic risk builds. It's like wall of water behind a dam—the longer the pressure builds, the more devastating the eventual release.
And if we use history as a guide, that question mark on our chart won't stay a question mark forever.
🫣 What happens to markets when spreads explode?
Here's where theory meets portfolio reality. When credit spreads blow out, it's not just a bond market problem—it's an everything problem.
What typically happens across asset classes:
Stocks: The Leveraged Get Liquidated
When credit spreads blow out, equity markets typically crater. Our S&P 500 vs credit spread chart showed you the historical pattern, but let's talk about the mechanism.
It works something like this:
Companies suddenly face higher borrowing costs, which hits future earnings projections. Growth companies that depend on continuous funding get hammered the worst. Share buybacks—which have been a major driver of stock prices—become uneconomical when debt costs spike.
But the real killer is forced selling. Hedge funds, private equity firms, and leveraged investors who've been gorging on cheap borrowing suddenly face margin calls. They don't sell the optimal positions—they sell what they can.
Some precedent: During the 2008 credit crisis, investment-grade spreads exploded from about 1.00% to 5.55% over the course of the crisis. The S&P 500 fell 57% from peak to trough. Even quality companies with strong balance sheets got obliterated in the liquidation wave.
Today's risk: With the S&P at 6,466 and spreads at 0.75%, the math suggests we're more vulnerable now than we were in 2007.
Bonds: No Longer the Safe Haven
As we have discussed before, bond portfolios can get destroyed when credit spreads explode—even "high-quality" bond funds.
See, most bond funds don't just hold Treasuries. They hold corporate credit to boost yield. When spreads blow out, the net asset values of these funds can fall 20-30% overnight.
Municipal bonds get hit too, as investors question local government finances. International bonds suffer as global credit conditions tighten simultaneously.
And though US Treasuries often see significant inflows as investors flee to ‘quality’, investors will likely demand premiums to protect against duration risk for longer-term bonds.
They get worried the Fed will do QE infinity and we have a 2021 situation all over again. Fed allows inflation to rage and real yields (yields minus inflation) go severely negative.
What about Bitcoin?
Bitcoin's behavior during credit crises is still being written, but as we have seen recently, Bitcoin does trade more like a risk asset than a safe haven during systemic stress.
March 2020 taught us one lesson. When COVID hit and credit spreads exploded from 1% to 4% in weeks, Bitcoin initially fell 50% alongside everything else. The "digital gold" belief wobbled as liquidity-starved investors sold whatever they could.
That said.
Bitcoin did recover faster than traditional assets, partly due to massive fiscal and monetary stimulus. But in the initial panic phase, it behaved like a leveraged tech stock, not a hedge.
March 2023 taught us another. During the Silicon Valley Bank crisis, when credit spreads briefly widened and investors panicked about deposit safety, Bitcoin soared. As regional banks collapsed and depositors worried about their money evaporating or being seized, Bitcoin rallied from around $20,000 to over $30,000 in the months following the crisis.
The pattern seems to be: In broad liquidity crises (like COVID), Bitcoin trades like a leveraged risk asset. But in banking/credit-specific crises (like SVB), Bitcoin can act as a hedge against systemic financial risk.
And so, if the next credit crisis specifically involves bank solvency or deposit safety (rather than just market liquidity), Bitcoin will likely benefit as investors seek alternatives to traditional banking systems.
What This Means for Your Portfolio:
When credit spreads are this tight, traditional diversification often fails. Stocks, bonds, and alternative investments all get hit simultaneously because they're all connected by the same credit plumbing.
The general principle during periods of extreme spread compression is defensive positioning: shorter-duration bonds, higher-quality equities, and maintaining dry powder for opportunities. Cash earning 4.50% in money markets suddenly doesn't look so bad when everything else is priced for perfection.
What exactly am I watching for as signals to an impending explosion of credit spreads?
A few things: high-yield spreads widening before investment-grade, corporate earnings missing by wider margins, and Fed officials suddenly expressing "concern" about credit conditions.
But the Fed itself has a dilemma.
It may have painted itself into a corner that didn't exist in previous credit cycles.
When credit spreads exploded in past crises, the Fed had room to cut rates dramatically—from 6.50% to 1.00% in 2001, or from 5.25% to 0.25% in 2008. Today, starting at 4.50%, they have far less ammunition.
If spreads blow out while inflation remains above 2%, the Fed faces an impossible choice: re-instate ZIRP (cut rates to zero) to save credit markets and risk reigniting inflation, or hold rates high and watch the system implode.
Meanwhile, the Fed continues (QT) Quantitative Tightening at $25 billion per month, removing liquidity precisely when credit markets might need it most.
When the inevitable crisis hits, expect emergency rate cuts back to zero, QE restart on steroids, and direct credit market intervention.
AKA, The Big Print (if you haven’t already, I highly recommend that you read Larry Lepard’s book, —it explains everything here and more).
The bottom line? All this emergency stimulus will likely reignite the exact asset bubbles and credit excesses that caused the crisis in the first place.
It goes like this:
boom → bust → bigger boom → bigger bust
With each cycle more extreme than the last.
Because if there's one thing 30 years of credit market history has taught us, it's that the question mark on our chart always eventually gets an answer.
And historically, it's rarely the answer anyone wants to hear.
That’s it. I hope you feel a little bit smarter knowing about credit spreads and how they may give us a clue as to what comes next in the economy and the markets.
If you enjoyed this free version of The Informationist and found it helpful, please share it with someone who you think will love it, too!
Talk soon,
James✌️
I'm curious how a widening of the credit spreads would impact the Strategy preferreds? I can make a case in both directions, but not sure which matters more.
Great Article James. Big Thanks.
Two Questions:
1. I use Yahoo Finance to keep track of Stocks and markets in general. Is there a way to get a live feed of credit spreads on to my Home page? It would be super useful if yes.
2. Given that you monitor Spreads on a daily basis and you know what’s what, would it be possible for you to send an Emergency Update to share what you are seeing and your reason(s) for deep concern.
Hoping for a positive response.
Best Regards