
💡 Why Global Bond Markets Are Imploding
The synchronized global sell-off, and is everyone really "turning Japanese?"

✌️ Welcome to The Informationist, the newsletter that makes you smarter about money in just a few minutes each week.
🙌 One topic. Exposed and explained so you can make better decisions with your money. Like a simple walk down Wall Street.
🫶 If this was forwarded to you, you have awesome friends. Join 45,000+ readers here.
Today’s Bullets:
🌍 The Synchronized Sell-Off
🗾 The Tokyo Comfort Blanket
🔀 Where the Japan Comparison Falls Apart
💱 The Real Adjustment Valve
💰 What It Means for Your Money
Inspirational Tweet:
Imagine showing up for your first day as CEO at a new job. You walk in, figure out where your office is, find the coffee machine, chat with your support staff, maybe start meeting your executive team.
Settled in now, you fire up your screens and immediately see twelve sovereign bond markets across three continents all in sync, all collapsing in real time.
But it’s no longer someone else’s problem. It’s your problem.
Because this is the US Federal Reserve, and you’re the new chair.
Welcome to the Thunderdome, Kevin Warsh.
On the sidelines, you may be tempted to chalk all of this up to a single headline. Iran. The Strait of Hormuz. Oil. Inflation. After all, those are the words you’ll see on every macro feed this weekend. On the front page of most mainstream media rags.
Yet the bigger story has been playing out across five years and three continents, quietly, while equities kept setting records.
And is now forcing us to ask the hard questions.
Like, what happens when bond markets across three continents move in lockstep, after five years of all moving the same direction?
Why does everyone in macro keep reaching for the “we’re all turning Japanese” analogy, and is the analogy actually right?
And most importantly, what does any of this have to do with you, your savings, and your investments over the next two years?
All good questions. And ones we’ll sift through nice and easy, as always, here today.
So pour yourself a big cup of coffee and settle into your favorite seat for a candid look at the global bond rout, and what it really means for your money, with this Sunday’s Informationist.
Partner spot

After 17 years, bitcoin is still widely misunderstood. You get it, but what about the bitcoin blind spots you don’t know you have?
Unchained just released Rethink Bitcoin → — a free interactive course covering the protocol, savings, custody, and network effects across 12 lessons and 21 interactive figures. This is the kind of thing you wished existed when you were learning, and the new best resource for those just beginning the journey.
For the friend or family member who won’t sit through 12 lessons, We partnered with Atlantic Re:think to make a short film for the curious featuring Natalie Brunell, Natalie Smolenksi, and our CEO Joe Kelly. Not the crypto story. The bitcoin story.
🌍 The Synchronized Sell-Off
Heads up, we’re going to talk about some numbers here, but they’re super important, so just stick with me, and don’t worry. We’ll go nice and slow.
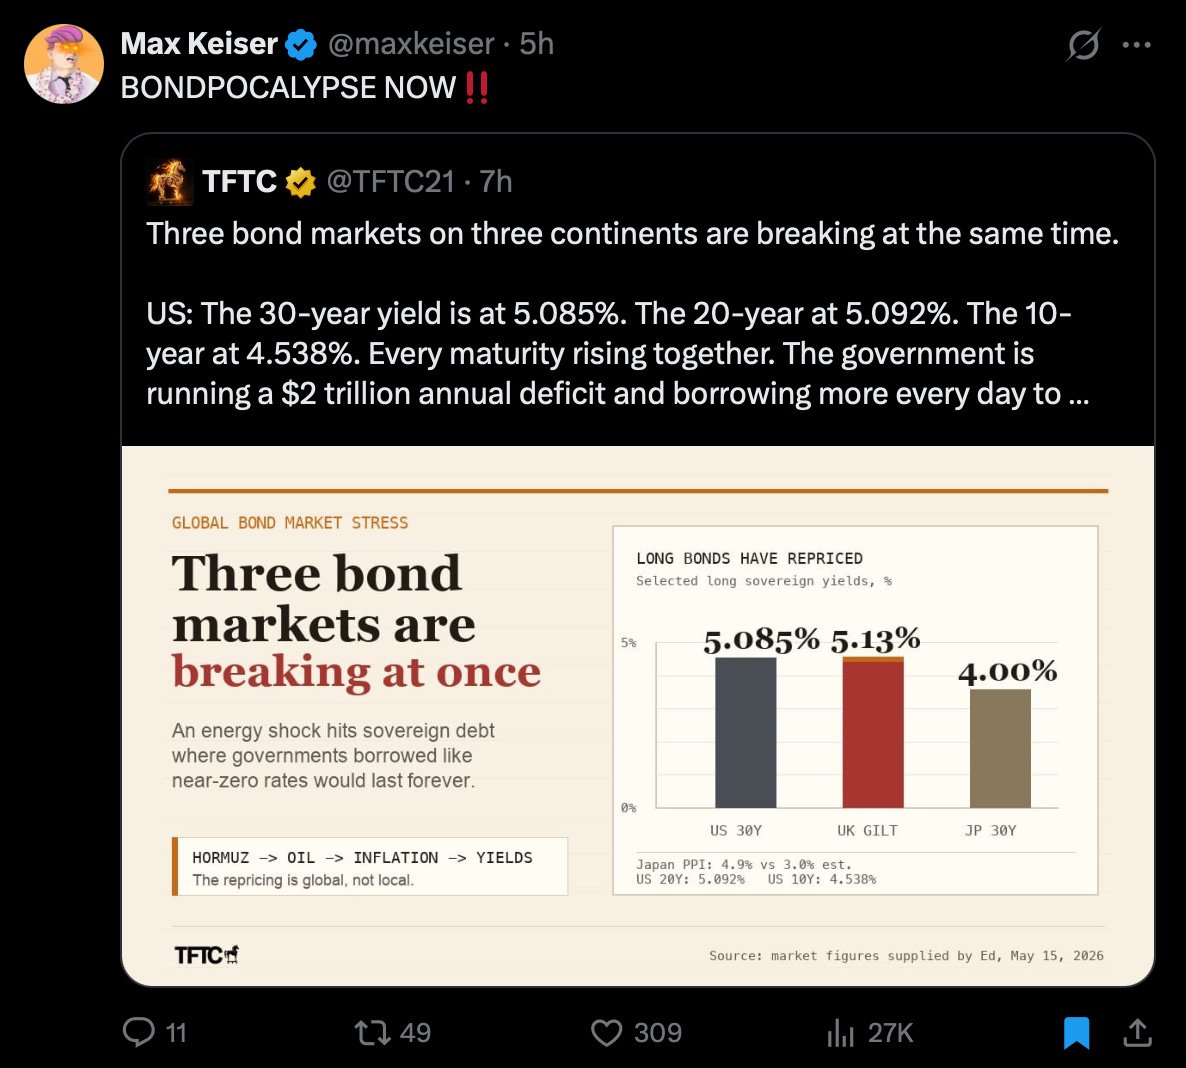
Let’s start with that three-bar chart in TFTC’s post above from Friday morning.
The US 30-year at 5.085%. The UK 30-year at 5.13%. The Japanese 30-year at 4.00%. Three markets, three continents, all hitting multi-decade or all-time highs in the same trading session.
And those numbers? Already stale.
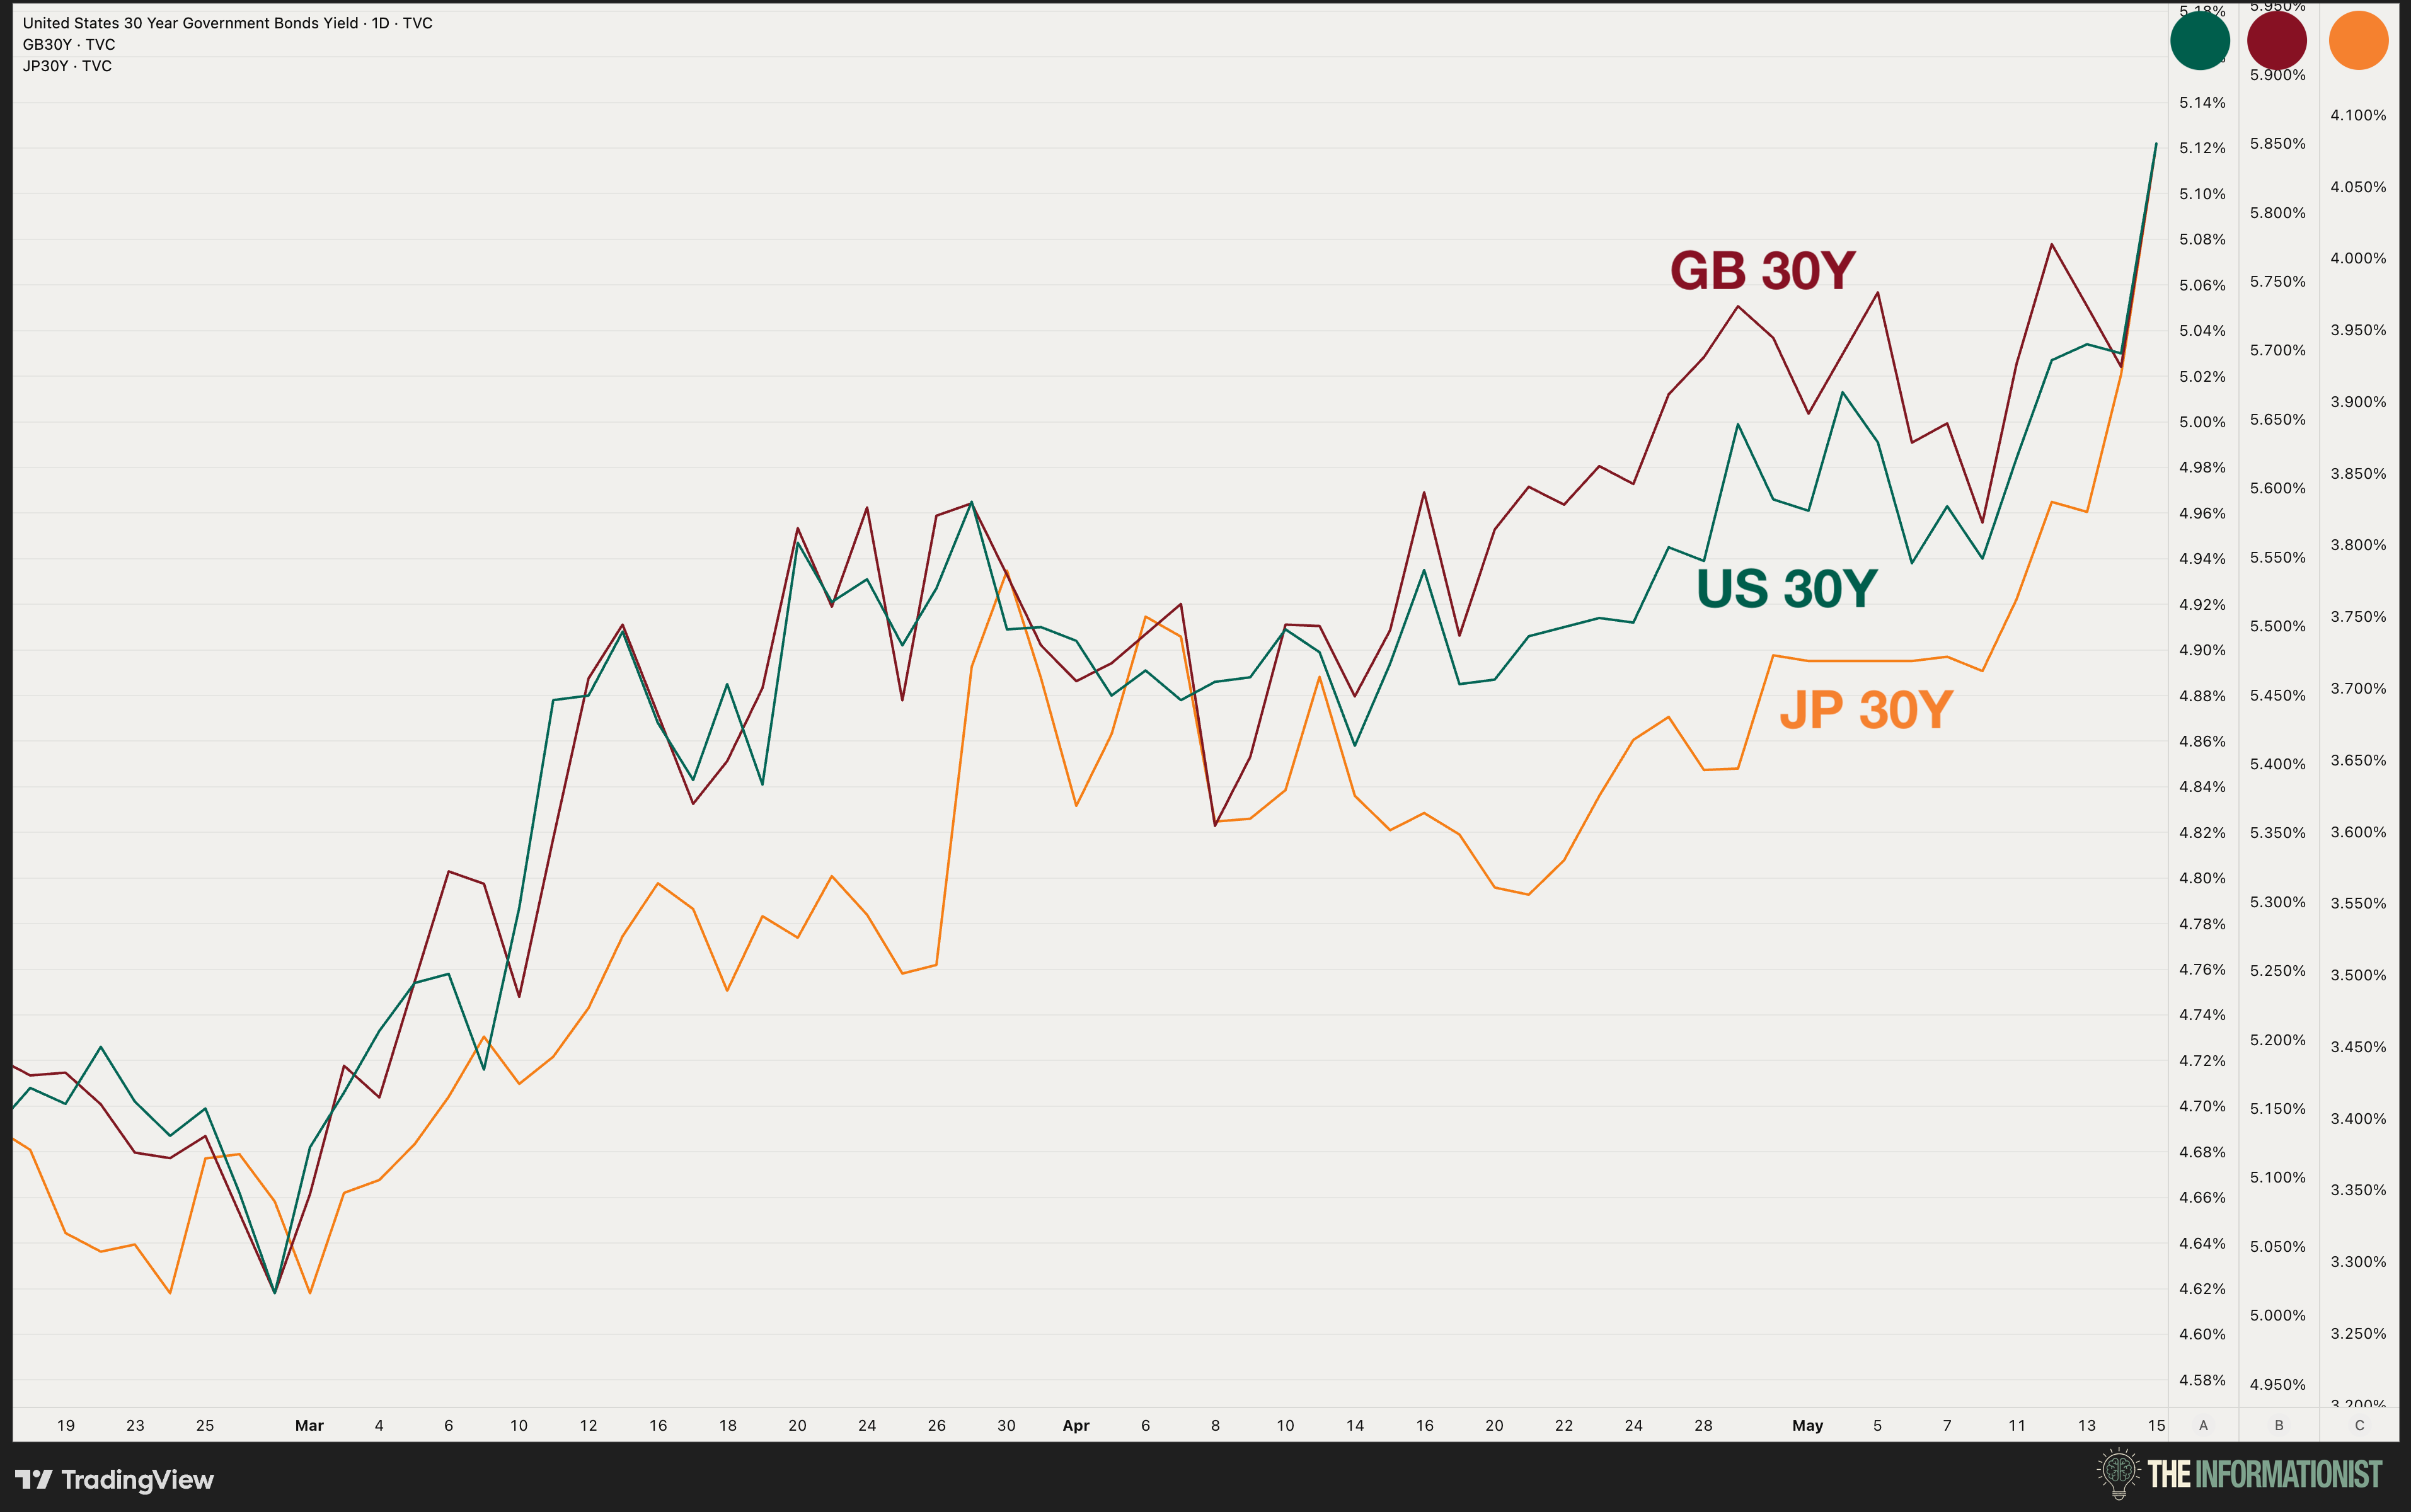
Because by the time Friday’s closing bell rang, the US 30-year had climbed to 5.12%. The UK 30-year touched 5.85%, a level not seen since 1998. The Japanese 30-year hit 4.02%, a record for a country that spent the better part of three decades fighting deflation.
In other words, the selling accelerated through the session, ignoring headlines, ignoring Fed statements, ignoring everything.
Some of you may recall, twelve sovereign bond markets rising on one trading day is something we’ve seen before. Mini-versions popped up during European debt panics, during 2022’s gilt episode (I wrote about that one when it happened, when the Bank of England had to step in to save UK pension funds from a leveraged LDI cascade), and during the Fed’s hiking cycle in 2023.
What makes this one different is the geography.
A typical synchronized selloff has a center of gravity. In 2022, it was the UK. In 2013, it was the US Taper Tantrum. In 1998, it was Russia and then LTCM. The bond market reprices around a single distressed asset, and the rest of the world re-rates sympathetically.
This week, there is no center.
The UK 10-year jumped 17.9 basis points. Italy added 17.3. Greece, 16.3. France, 15.5. The US 10-year rose 11.5. Japan, 8.6. Every developed sovereign on the screen moved the same direction on the same day.
One direction. Three continents. No single distressed asset to blame.
This is what financial markets call a correlation event. And when the correlation lines up across sovereign issuers, the cause has to be structural and global, not country-specific. The bond market is pricing something the world has been moving toward for years. Friday was the moment everyone noticed at the same time.
Now, the 30-year is where the drama lives. Long-duration bonds always move the most when something fundamental shifts in expectations or term premium, because the math of duration amplifies every basis point of change. So when we want to see the move at its loudest, the 30-year is where we look.
The bond that does the actual structural work, though, is one maturity shorter.
The 10-year.
The US 10-year Treasury is the benchmark of benchmarks. It’s the reference rate for nearly every dollar-denominated borrowing decision on the planet: mortgages, corporate loans, sovereign credit pricing, valuation models, the entire concept of a “risk-free rate.” Every other country’s 10-year operates as the local equivalent for its own credit and lending cycle.
If the 30-year shows you the drama, the 10-year shows you the disease.
So let's look at the disease, starting a few years back.
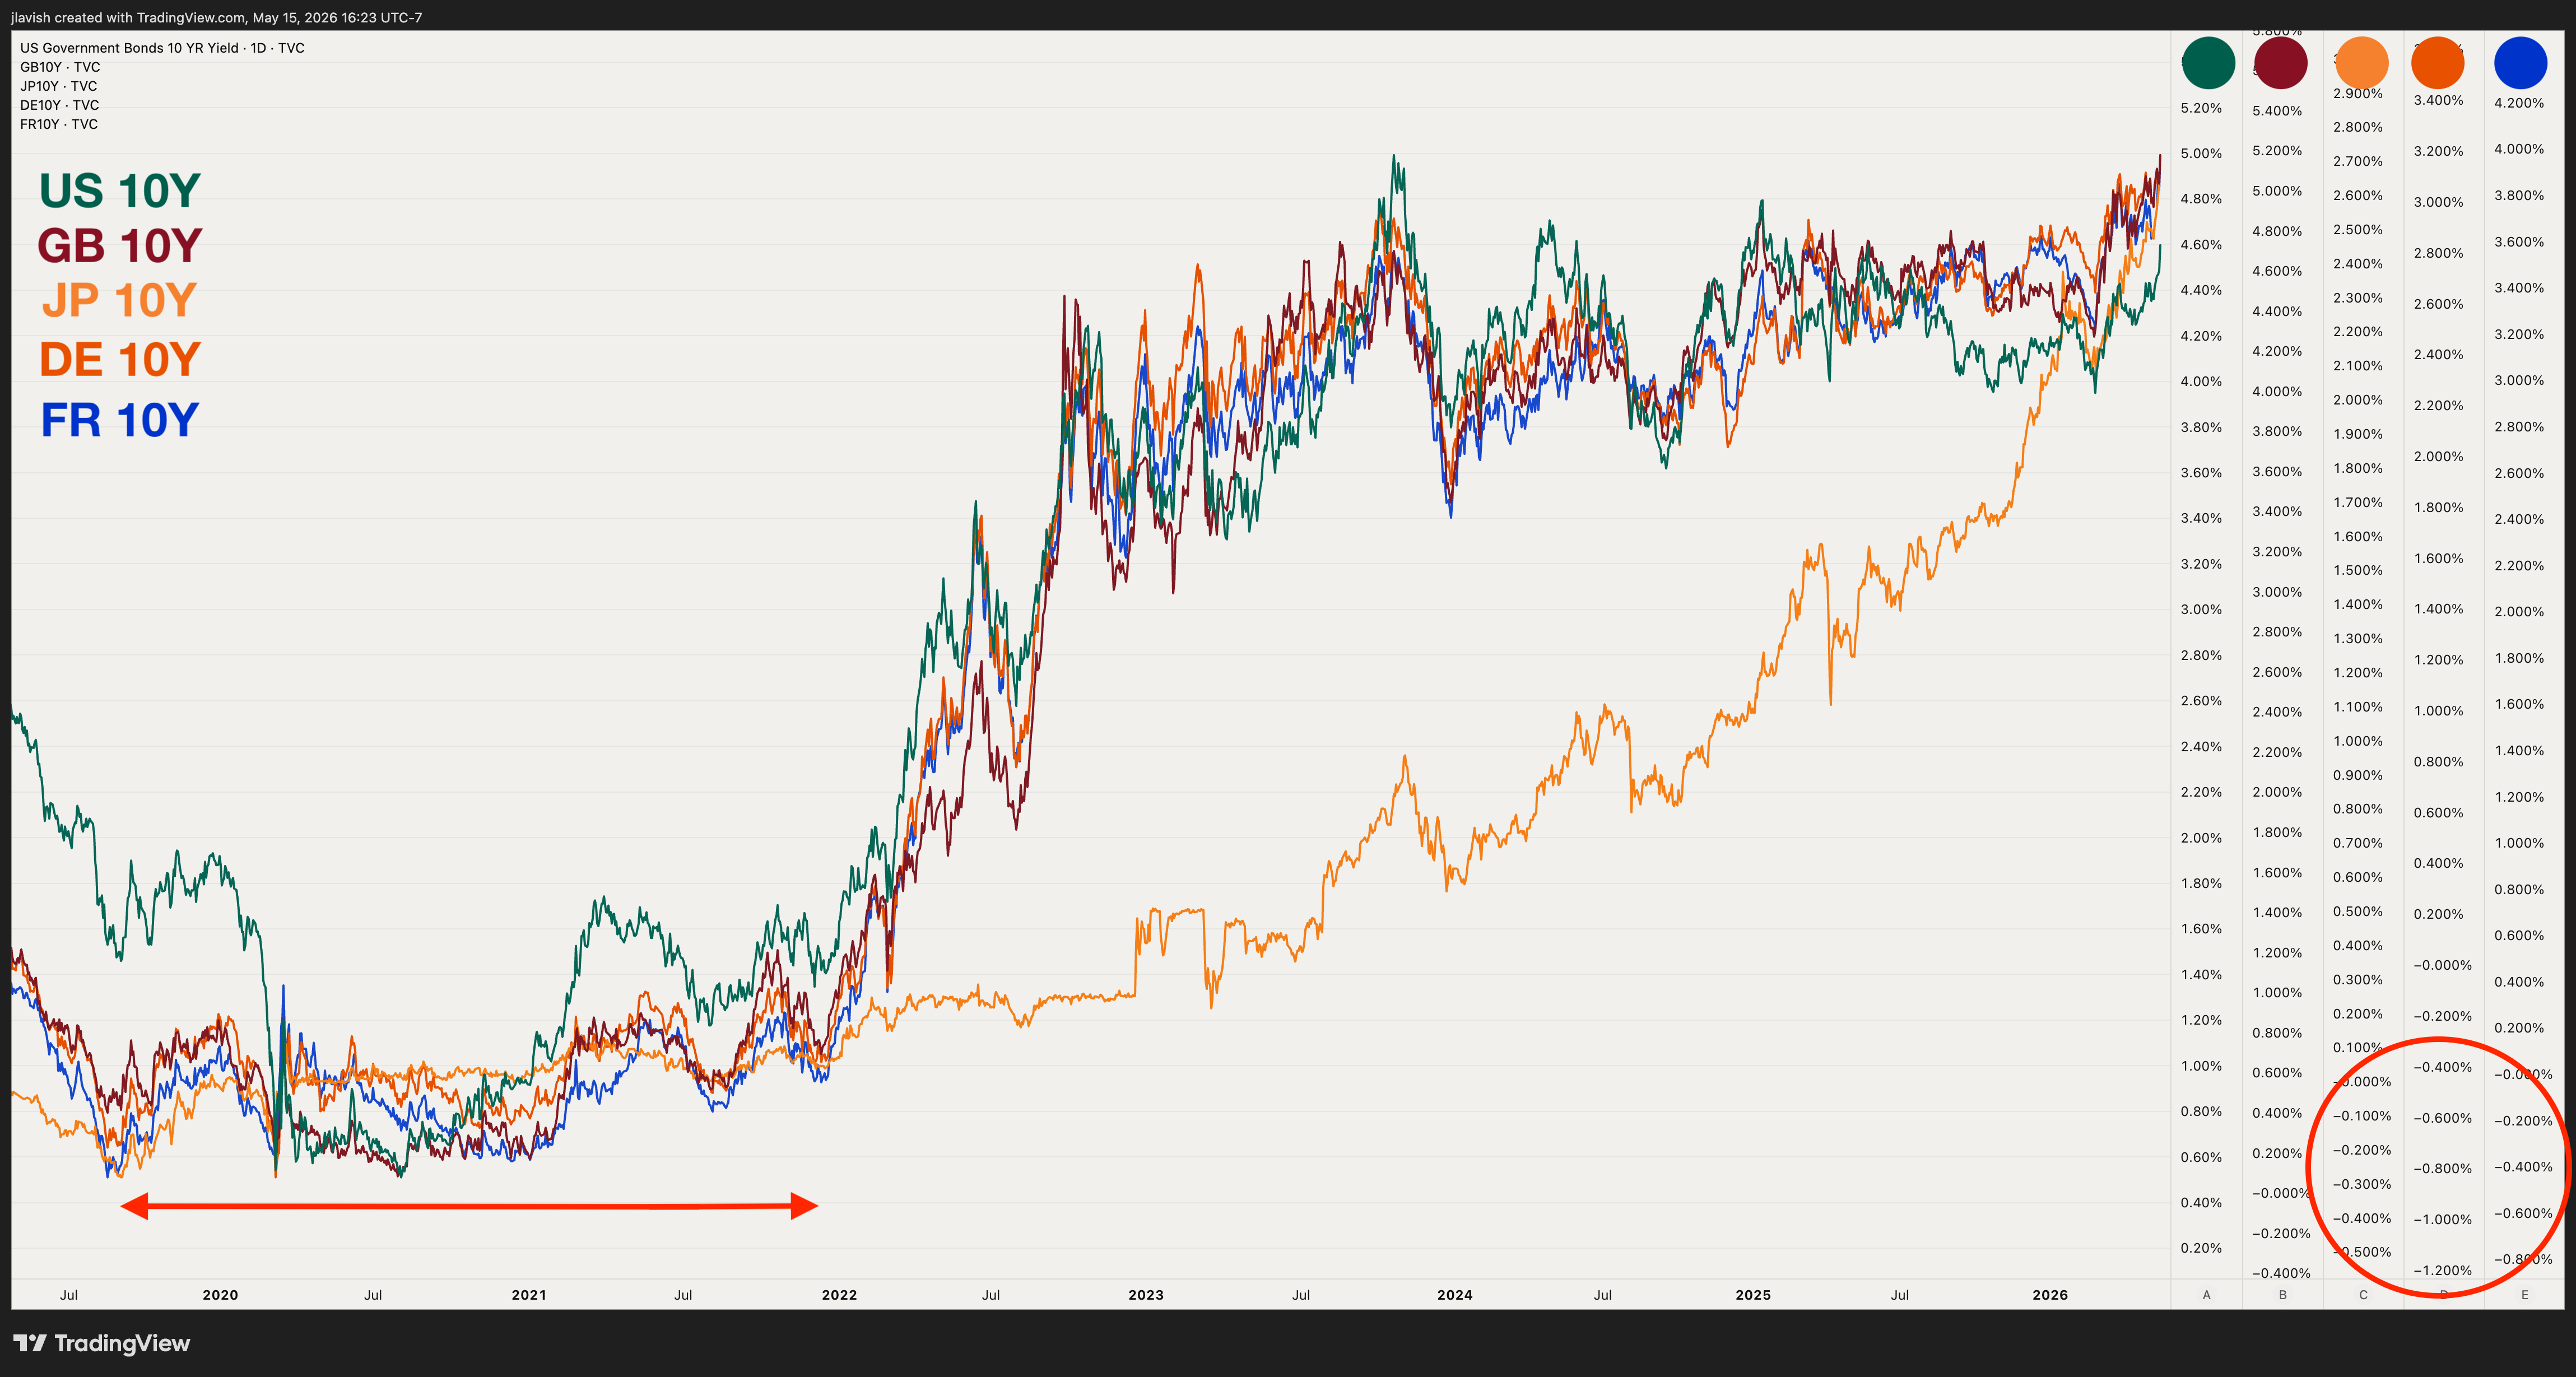
Look at the period from 2019 through early 2022 on that chart. Those are the years when the world’s benchmark borrowing rates lived in suppressed territory.
The German 10-year sat below zero. So did France's. The Japanese 10-year was pinned near zero by the Bank of Japan's yield curve control program. The US 10-year, the global benchmark, traded around 1%.
Read that again slowly. The world’s benchmark borrowing rates were negative or near zero across most of developed Europe and Japan.
Yes. That’s right.
Investors paid governments to lend them money for years.
Then yields exploded.
Just in the past five years, the repricing has been violent:
UK 10-year, up 431 basis points
France 10-year, up 353
Germany 10-year, up 328 (from below zero)
Netherlands 10-year, up 324
Spain 10-year, up 299
US 10-year, up 295
Italy 10-year, up 284
Japan 10-year, up 263
Most developed-world benchmark rates have been repriced by three to four-and-a-half percentage points over five years. A magnitude of move that would have seemed implausible to anyone who lived through the 2010s.
This is what the world’s bond market has been quietly doing while everyone watched stocks: repricing what it costs governments to borrow money at the maturity that anchors every other lending decision on earth. The repricing has been compounding for half a decade. Friday’s session was the latest, loudest reminder.
So what is the bond market actually saying?
Two things. Loudly. To anyone willing to listen.
First, the era of essentially free money for sovereign borrowers is over and not coming back. Negative 10-year yields across the developed world were a symptom of unprecedented central bank intervention, and that intervention has now reversed.
Second, and more important: bond traders no longer believe central banks can control the long end of their own yield curves. Not the way they once could.
That second point is what makes this moment dangerous. It’s also where everyone in macro starts reaching for the same comforting comparison.
They look at central banks losing control of long yields, at debt loads only sustainable at suppressed rates, at governments that need their own bonds bought back, and they reach for the only modern example we have of a major economy that has lived through exactly that experience.
Japan.
The analogy seems to be everywhere right now. “We’re all turning Japanese.” It shows up in research notes, on macro podcasts, in panel discussions, in tweets from analysts I truly respect.
I must admit. It is a comforting comparison.
And it breaks down at the part that matters most.
