
What is the Risk-Reward of Bitcoin?
Issue 105

✌️ Welcome to the latest issue of The Informationist, the newsletter that makes you smarter in just a few minutes each week.
🙌 The Informationist takes one current event or complicated concept and simplifies it for you in bullet points and easy to understand text.
🫶 If this email was forwarded to you, then you have awesome friends, click below to join!
👉 And you can always check out the archives to read more of The Informationist.
Today's Bullets:
Risk Examples
Rewards
Probabilities
The Analysis Made Simple
Inspirational Tweet:
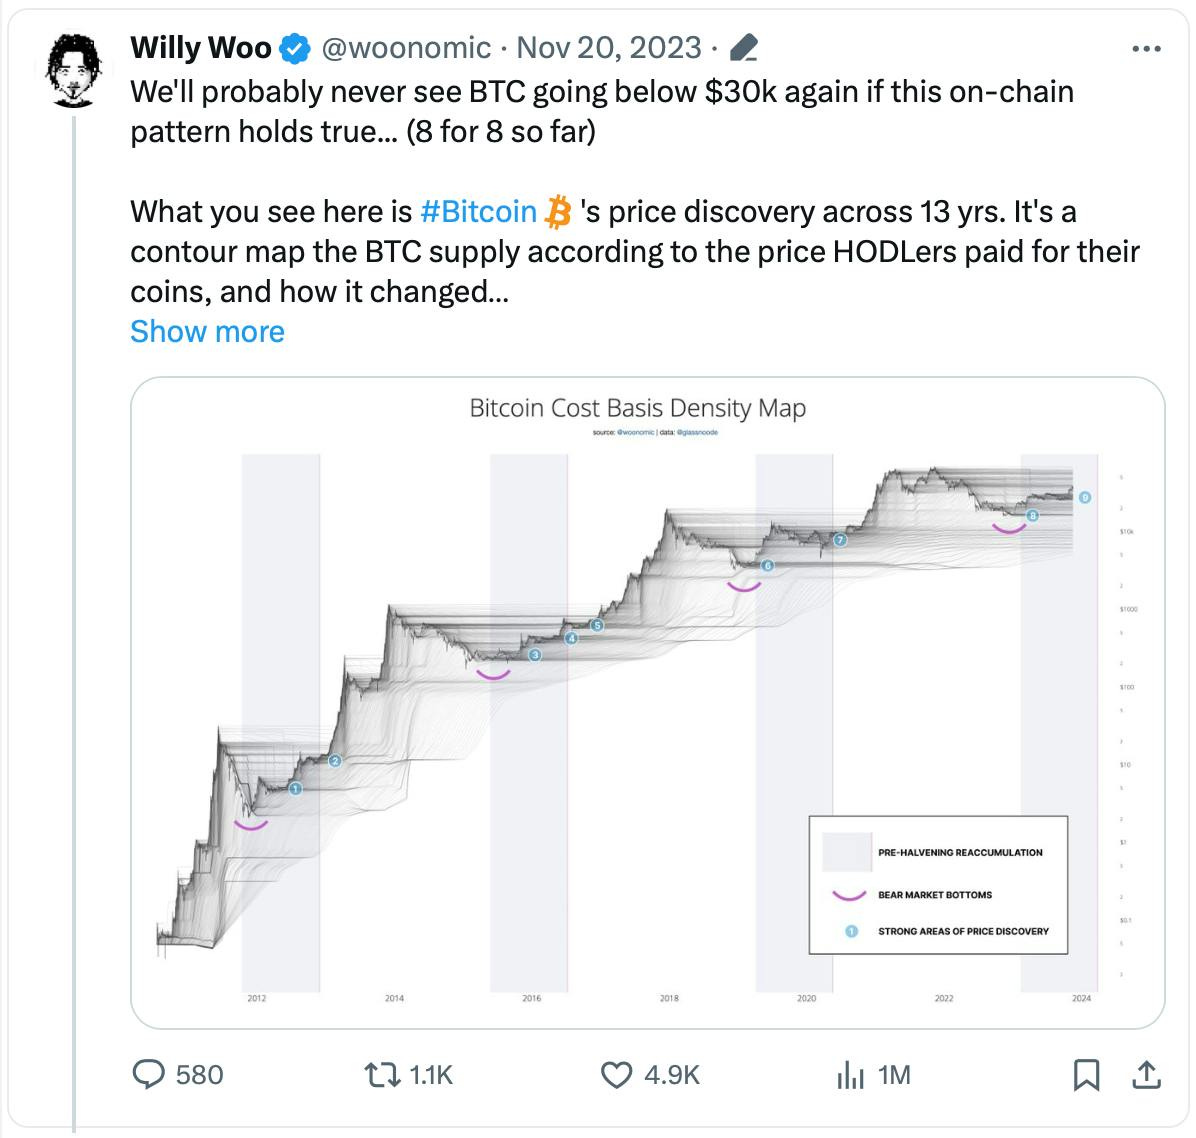
Bitcoin.
Few assets or subjects in this world generate as much or more of a polarizing response than Bitcoin does.
It's going to zero.
It's going to a million.
It's staying at $52,500 forever!
Regardless of where you think bitcoin is headed, or why, it can be useful to visualize your belief.
I personally like to do this with a risk/reward probability analysis. I know, I know, #mathishard. But hear me out, because this type of exercise can help crystallize in your mind what your conviction is and how it compares to current market sentiment.
But don't worry. We are going to keep it easy as pie, as opposed to pi today.
So, grab a cup of coffee, and settle into your favorite front row seat, as we explore risk/reward today with The Informationist.
🧐 Risk Analysis
The point of today is not to determine the final risk/reward for Bitcoin, or demonstrate where I think it is going. The purpose, rather, is to give you the tools to do this type of analysis yourself.
This will be much more useful to you in the long run with your own investing and looking at other similar opportunities in the future.
Now that we have that straight, let's play with some number, shall we?
First things first, I like to determine what this risk is in a situation. This helps me understand just how binary the opportunity may be.
Binary: meaning it's either a zero or a one.
Hopefully, this is not the case.
With Bitcoin, when considering downside risk, there are many factors to take into consideration, like time frame or investment horizon, events on the horizon (such as ETF approval or denial), on chain metrics, hash-rate and halving cycles, as well as trade analysis (TA) support levels and volumes, etc.
One metric many longer-term Bitcoin investors have used is the ~80% drawdown from previous high.
This is where Bitcoin seemed to have gravitated back to after extreme blow-off top rallies.
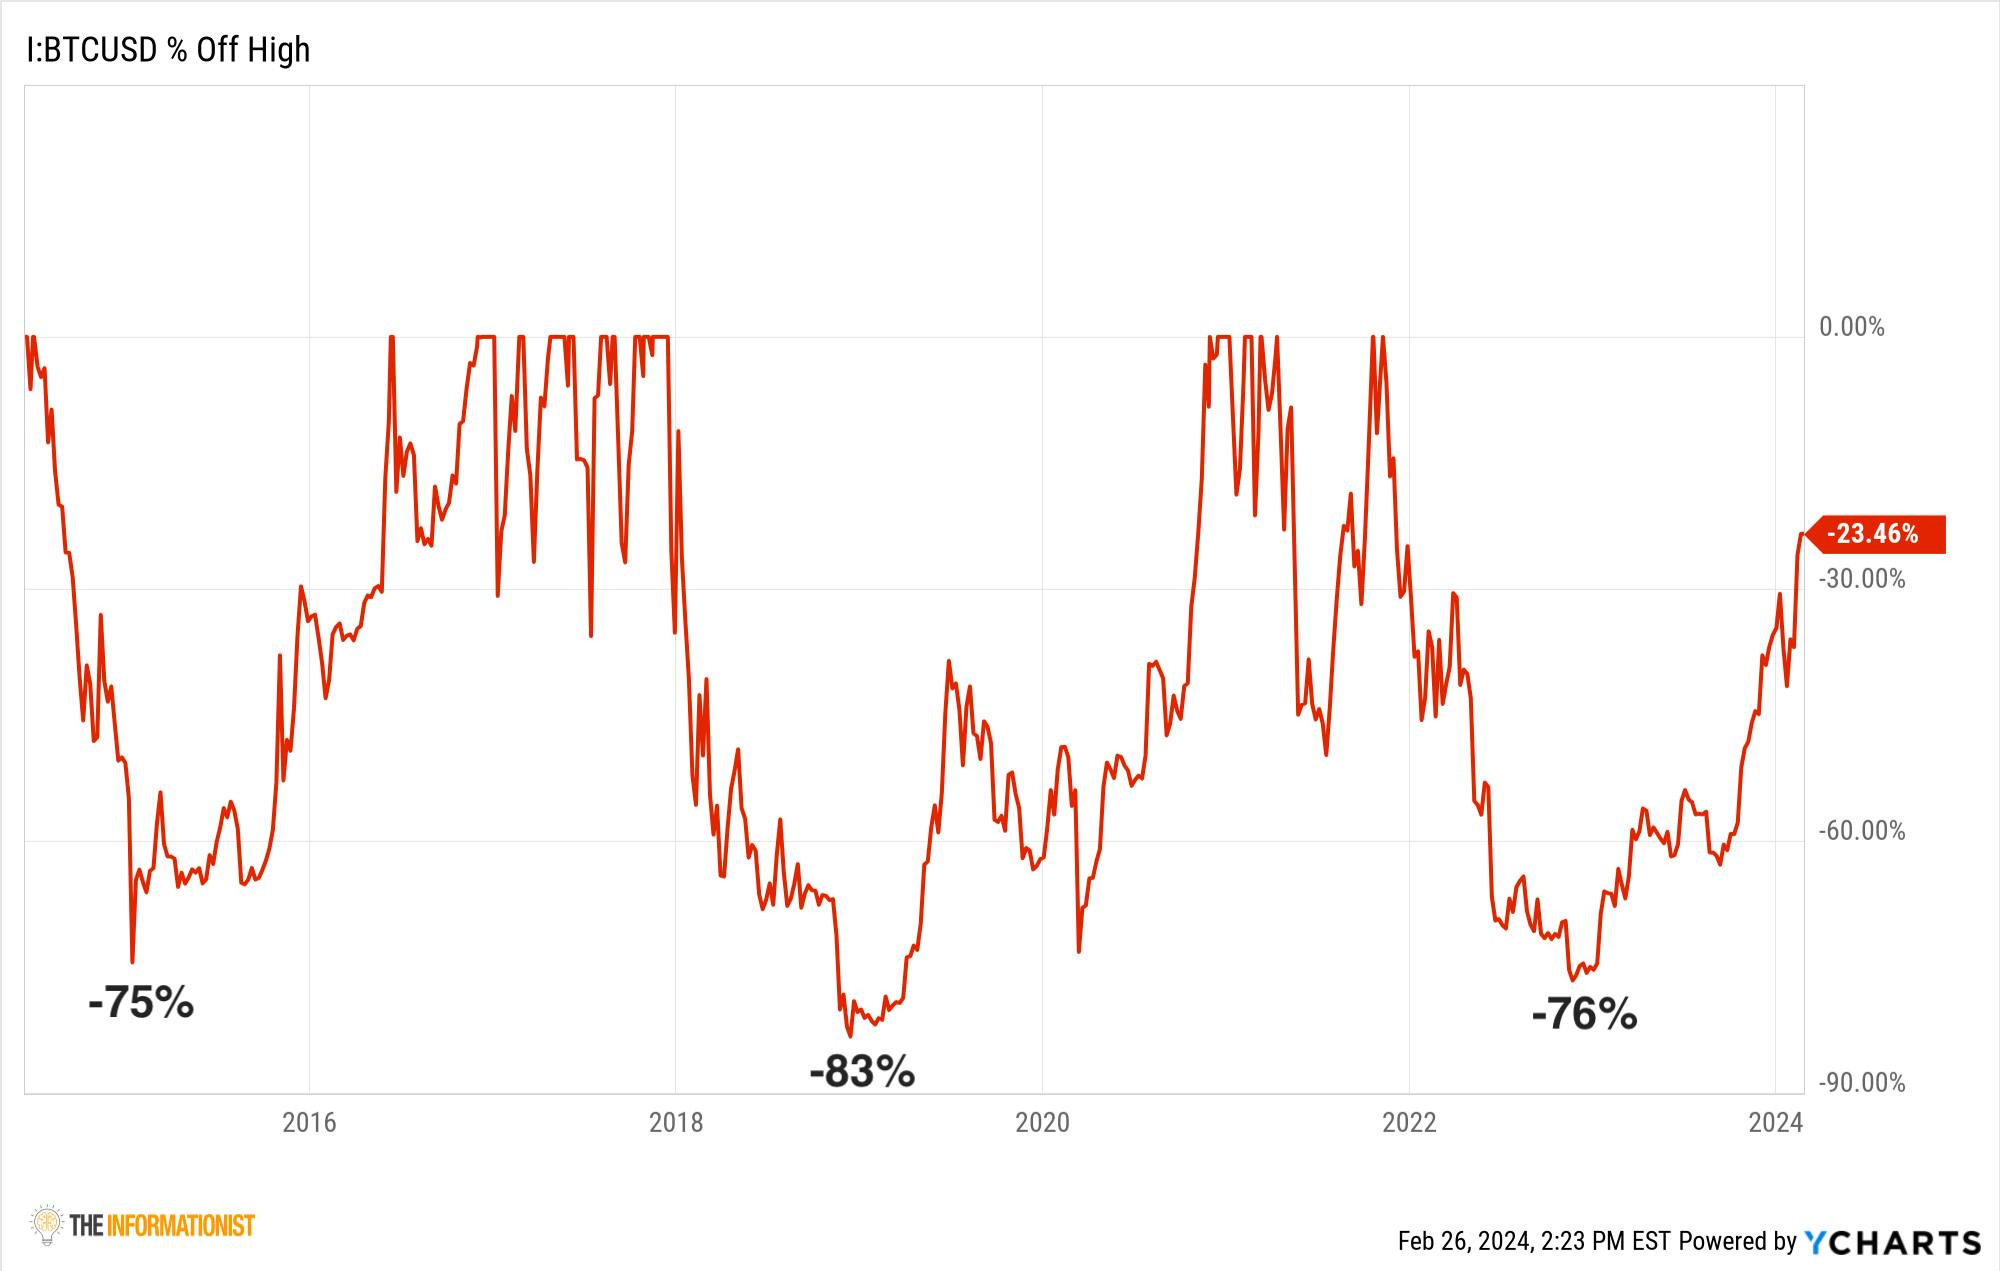
Actually a solid track record, though a small sample size. Two prior drawdowns to this chart hit -93% and -85%.
As I write this (a few days early, as I am headed to Madeira for a...Bitcoin conference) Bitcoin sits at $52,000.
We will use $50,000 to keep everything nice and easy with round numbers today, though.
Even though, as you can see on the chart, Bitcoin has already pretty much hit this drawdown level, there is no guarantee that it won't test it again.
Do I think it will? No. but that's besides the point.
So let's use the recent low as the same downside from the last high in our calculations.
This number is $15,473.
Since this is not an exact science, we will use $15,000-even for our low.
And so, using $50,000 for Bitcoin today, this represents a 70% downside from here.
*Again, this is not a prediction, but for illustrative purposes only.
🤔 Reward Estimate
Next, we look at the upside. If we invest in this situation, what is the multiple we can reasonably expect as the upside to the binary calculation?
Well, again, there are many factors we must consider, including all of the same ones as the risk factors listed above, and TA resistance levels, etc.
But let's use a slightly different approach, to demonstrate another way to value an asset.
Looking at Bitcoin, we could calculate the total market value of the currency versus other assets, such as gold.
Knowing gold has approximately $10T in total value, we can extrapolate a value for Bitcoin, assuming it captures a certain percentage of the market value of gold in the near future.
Using 50% of gold value, we can calculate that the Bitcoin market value would be $5T, which gives us a price of $238K per Bitcoin:
$5T divided by 21 million Bitcoin = $238K
This is extraordinarily conservative, though, and perhaps you want to expand that analysis to include all investible assets, but with a smaller capture rate.
If we were to assume that all investable assets in the world, including stocks, bonds, real-estate, gold, and cash is $700T, and we assume that Bitcoin eventually captures 3% of the total global investible assets, then:
$700T * .03 = $21T
and
$21T divided by 21 million = $1M per Bitcoin.
Maybe you use that number, maybe you use a blend of the two. It's up to you.
For our purposes today, we will use $1 million upside.
This, then, represents a 20X upside from here:
$1M divided by $50K = 20X
✍️🤨 Risk vs Reward
OK, so now that we have the downside risk of 70% and the upside potential of 20X, we can calculate the risk-reward.
*Note: even though this is mathematically calculated as a reward/risk analysis, it is commonly referred to as 'risk-reward'.
I know. Wall Street purposefully confuses and obfuscates.
In any case, we now simply divide the Reward by the Risk and this gives us our metric.
20 divided by .7 = 28.5X
All this means is that the reward is 28.5X the risk, in our analysis.
If the upside was only 2X, and the downside was 100%, then the risk-reward would look like this:
2 divided by 1 = 2X
Not that great.
However 28.5X is fantastic.
All day, every day, in my book. But this is only one analysis.
In practice we would do many of these and plot them out in a matrix. Then we could visually see the pattern and make more of a reasonable conclusion from it.
But what about the probability of the 20X upside to $1 million? How likely is that to happen?
🤓 Binary Probability Analysis
This is where is gets really interesting, at least to me.
See, the binary probability analysis takes what we calculated above and extrapolates a market implied probability that it will happen.
In other words, it tells you what the market estimates the probability of hitting that upside target to be.
How?
If you want to eyeball the probability of upside it's basically the amount of possible downsidefrom here (50,000 - 15,000 = 35,000) divided by the amount of possible upside from here (1,000,000 - 50,000 = 950,000).
35,000 divided by 950,000 = .037 = 3.7%
If you are a mathematician and want to get technical, the actual formula is this:
The binary probability formula: Market Priced Likelihood of Reward = (Risk/Reward) / (1+(Risk/Reward))
So, it is:
(35,000/950,000) / (1 + (35,000/950,000)) = (.04) / (1.04) = 3.55%
And so this means that the market is estimating the probability of Bitcoin reaching $1,000,000 from here is 3.55%.
Which also means that the market assumes that there is a 96.45% probability of downside, or Bitcoin going back to $15,000.
To then bring it all together, when you look at this, do you personally believe the market is underestimating or overestimating the upside probability.
In other words, do you believe there is a greater than 3.5% chance of Bitcoin going to $1 million?
If you do, then the market is either underestimating the upside or overestimating the downside.
And so, to bring it all together:
With a 28.5X risk/reward (upside versus downside), and the market estimating a 3.5% chance of Bitcoin going to a target of $1 million, you can determine whether you agree with the market or disagree, one way or another.
Perhaps you believe that the market is overestimating the upside, and you think there is zero probability of Bitcoin going to $1 million. In this case, you would look to short BTC.
(I do NOT recommend this, BTW, I am just illustrating the analysis here)
On the other hand, if you are like me, and you believe the market is severely discounting(underestimating) the probability that Bitcoin goes to $1 million, and you agree with the 28.5X Risk/Reward (or better), then Bitcoin presents a fantastic opportunity to buy here.
I happen to believe that the ultimate upside for Bitcoin is much higher than $1 million per coin, and I also believe that the downside is much higher than $15,000 now. I see this as highly unlikely, even as volatile as Bitcoin has been.
And so, for me, Bitcoin is a Strong Buy.
But hey, that's me, and you need to do your own analysis and probability matrix (5 or more of these outcomes) to determine where you stand in relation to the current market price.
And now, hopefully, you feel extremely comfortable doing just that.
That’s it. I hope you feel a little bit smarter knowing about probability analyses and are ready to start incorporating this angle of analysis into your own investing with Bitcoin or anything else.
If you enjoyed this newsletter and found it helpful, please share it with someone who you think will love it, too!
Talk soon,
James✌️