
💡What Fear & Greed Signals to the Market
Issue 193

✌️ Welcome to the latest issue of The Informationist, the newsletter that makes you smarter in just a few minutes each week.
🙌 The Informationist takes one current event or complicated concept and simplifies it for you in bullet points and easy to understand text.
🫶 If this email was forwarded to you, then you have awesome friends, click below to join!
👉 And you can always check out the archives to read more of The Informationist.
Today’s Bullets:
What Is the Fear & Greed Index?
The Contrarian Case vs. The Falling Knife
Bitcoin, Market Concentration, and Is It Different Time?
Investment Implications
Inspirational Tweet:
Markets are emotional beings. They swing from greed to fear and back again, often in ways that seem irrational. When everyone’s afraid, prices plummet. When everyone’s euphoric, prices soar.
And right now? The Fear & Greed Index is screaming in terror.
Both stocks and Bitcoin have hit levels of extreme fear historically seen at major economic turning points.
But strangely, the S&P 500 is still trading near all-time highs.
And the two assets are behaving completely differently to the same fear signal.
Something doesn’t add up.
So we have to ask, what exactly do these Fear & Greed indexes measure, and how do they work? Is this a classic contrarian buy signal, or a warning about something deeper?
Also, why are stocks and Bitcoin reacting so differently? And what should investors actually do about it?
Good questions, and ones we will answer ,nice and easy as always, here today.
So, pour yourself a big cup of coffee and settle into your favorite seat for a look at market psychology and possible contrarian signals with this week’s Informationist.
Partner spot

Secure your bitcoin’s future—and your family’s peace of mind. Too many heirs lose access to bitcoin because there’s no clear inheritance plan. We’ll show you how to change that.
This past week, Dhruv Bansal (CSO, Unchained), Jeff Vandrew (CFO & CLO, Unchained), and Joshua Preston (CEO, Gannett Trust) hosted a live fireside chat on how to make your bitcoin legacy secure, simple, and built to last.
What they covered:
Transfer on death beneficiaries: A new Unchained feature for designating who inherits your bitcoin and remove uncertainty for your family.
Connections: Our vaults are uniquely built to let you share custody to help your heirs or trusted partners securely recover your bitcoin when it matters most.
Estate planning: How Gannett Wealth Advisors’ expert financial guidance integrates with Unchained to protect your keys and your legacy.
Watch the entire conversation replay, streaming now for free.
😱 🤑 What Exactly is the Fear & Greed Index?
If you’ve spent any time watching financial news or scrolling through market commentary, you’ve probably seen the CNN Fear & Greed Index.
You know, that speedometer-looking gauge that swings between extreme fear and extreme greed, supposedly telling us what investors are feeling at any given moment.
But don’t make the mistake of assuming it’s just some vague sentiment poll or gut-check survey. The Fear & Greed Index is actually a composite of seven distinct market indicators, each measuring a different aspect of investor behavior.
And right now? Both the stock market version and Bitcoin’s version are expressing Extreme Fear.
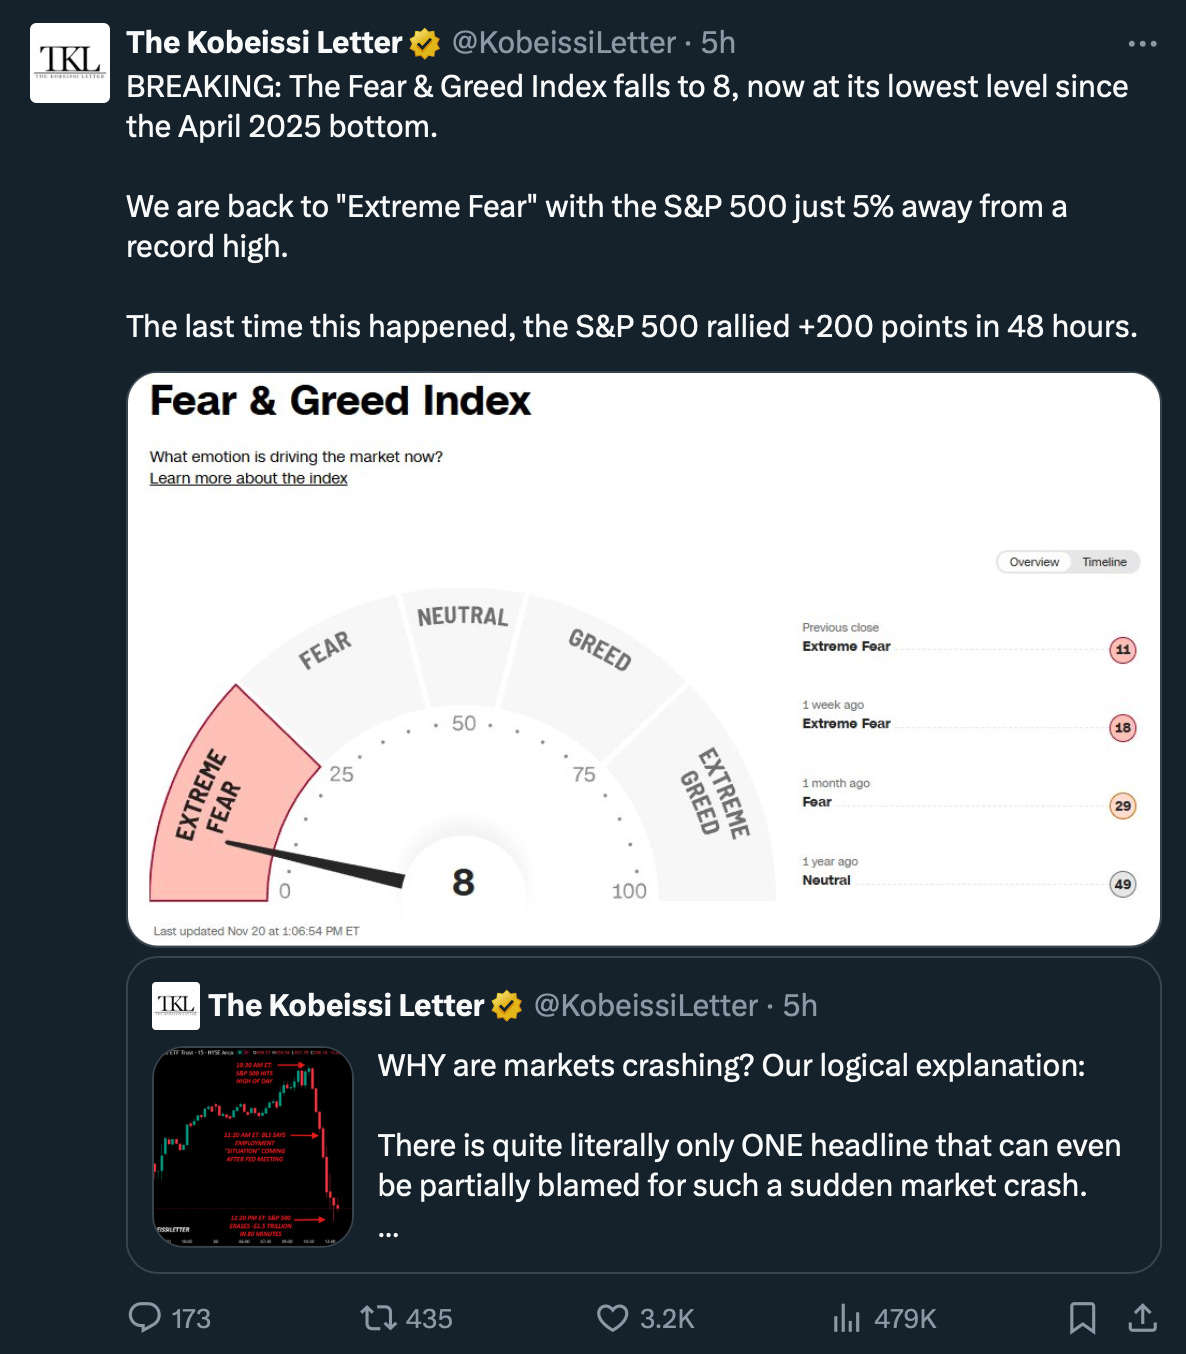
This past week, the stock market Fear & Greed Index hit 8 out of 100, before bouncing back to 10 on Friday. Still Extreme Fear territory.
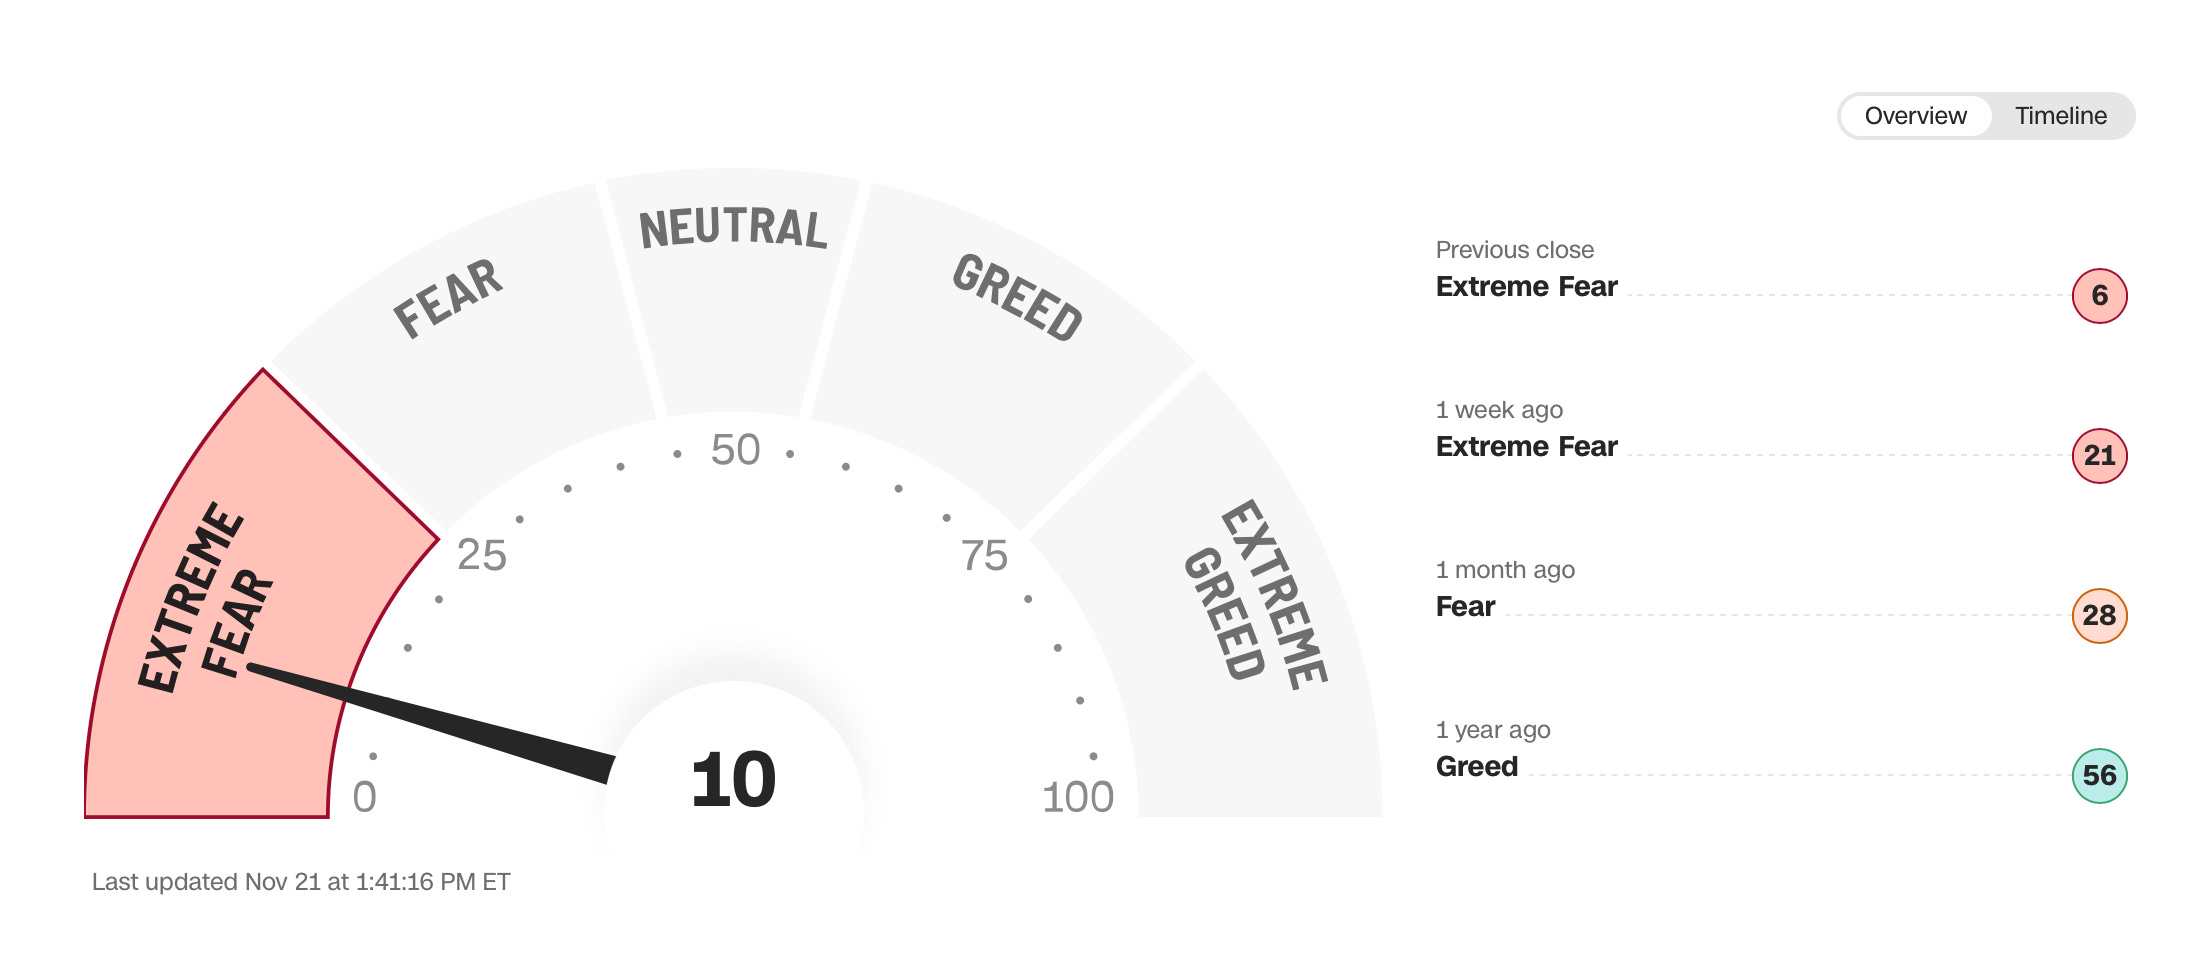
But here is what’s confusing: the S&P 500 is just 5% off its all-time highs.
You read that right. We’re near record levels, yet the fear gauge is at 10.
That’s like Liz Warren and Bernie worrying that Big Pharma donations will soon dry up.
So, what gives?
To understand better, let’s break down the index and what exactly it is calculating.
Seven Components of Stock Market Fear & Greed:
1. Market Momentum – This measures the S&P 500’s current level versus its 125-day moving average. When the market trades significantly below its recent trend, it signals rising fear. When it’s well above, greed has taken over.
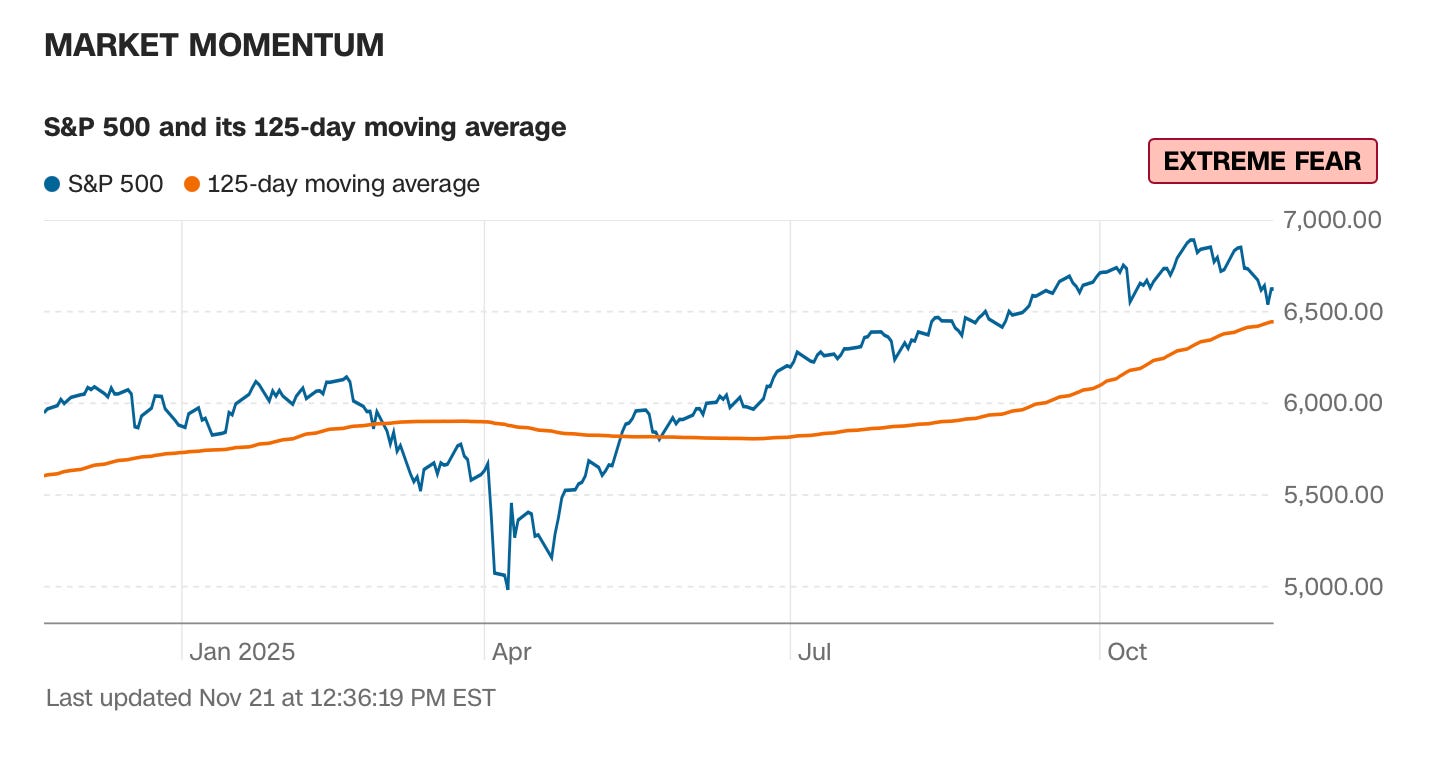
The recent pullback has pushed the S&P sharply toward that moving average, indicating a spike in fear.
2. Stock Price Strength – This component tracks the number of stocks hitting new 52-week highs versus new 52-week lows on the New York Stock Exchange. When more stocks are making new highs, greed dominates. When lows outnumber highs, fear rules.
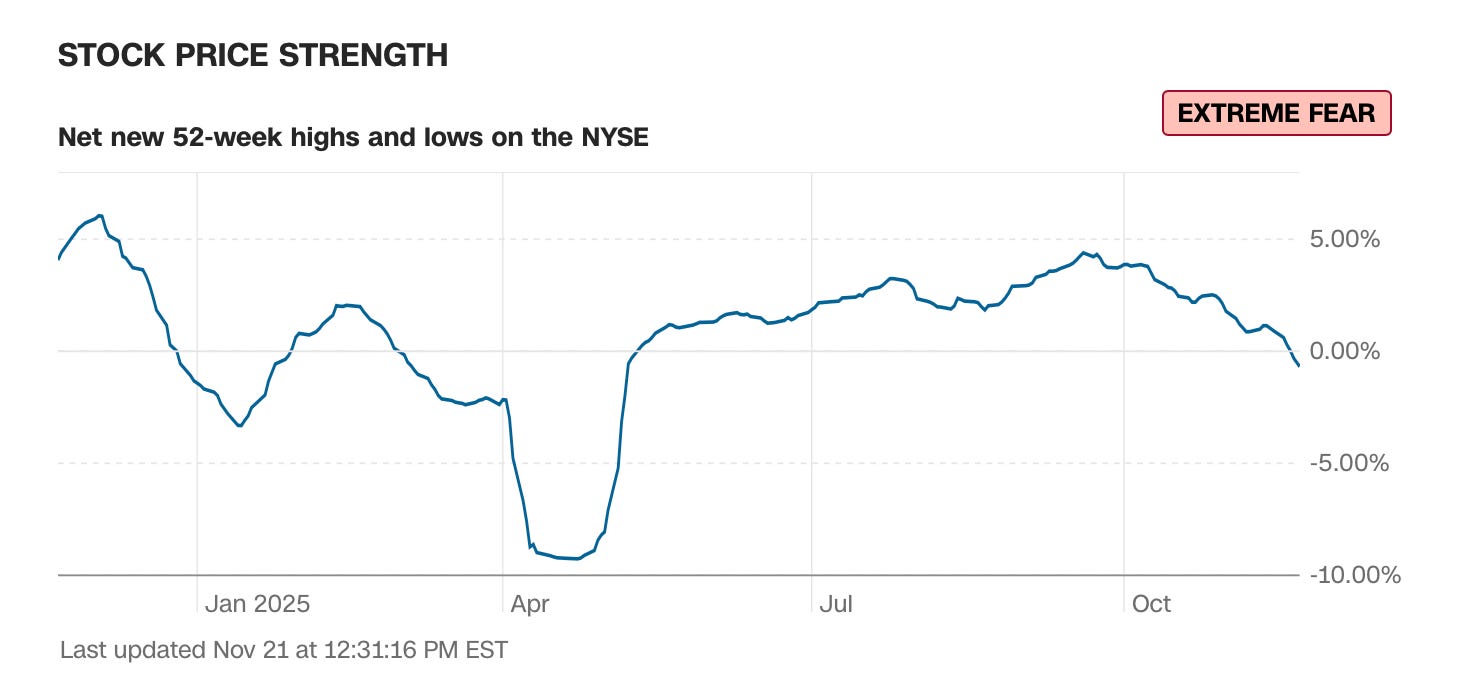
Right now, the net reading has turned sharply and become negative. More stocks are making new annual lows than highs—even though the S&P is near record highs.
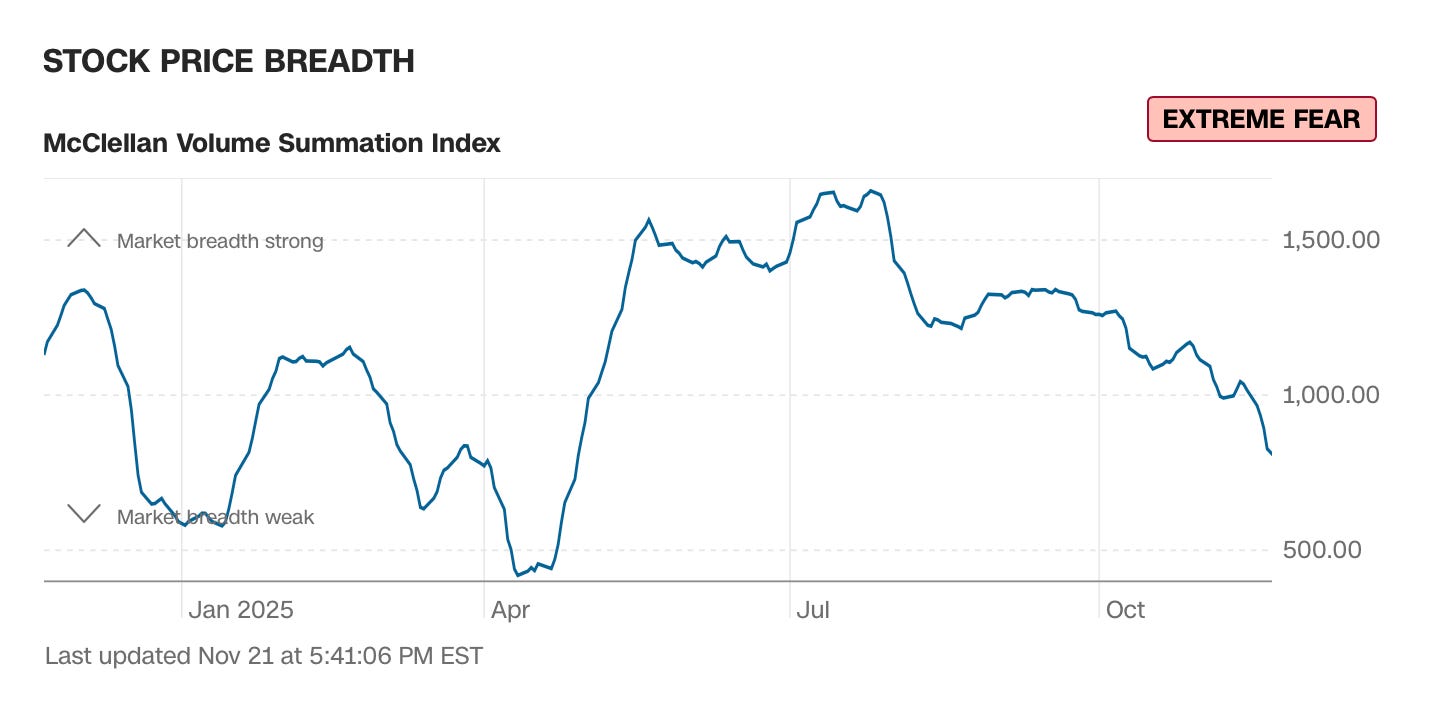
3. Stock Price Breadth – This measure looks at the amount, or volume, of shares on the NYSE that are rising compared to the number of shares that are falling.
4. Put and Call Options – The put/call ratio measures demand for protective put options (bets that stocks will fall) versus call options (bets they’ll rise). When investors pile into puts, it signals fear.
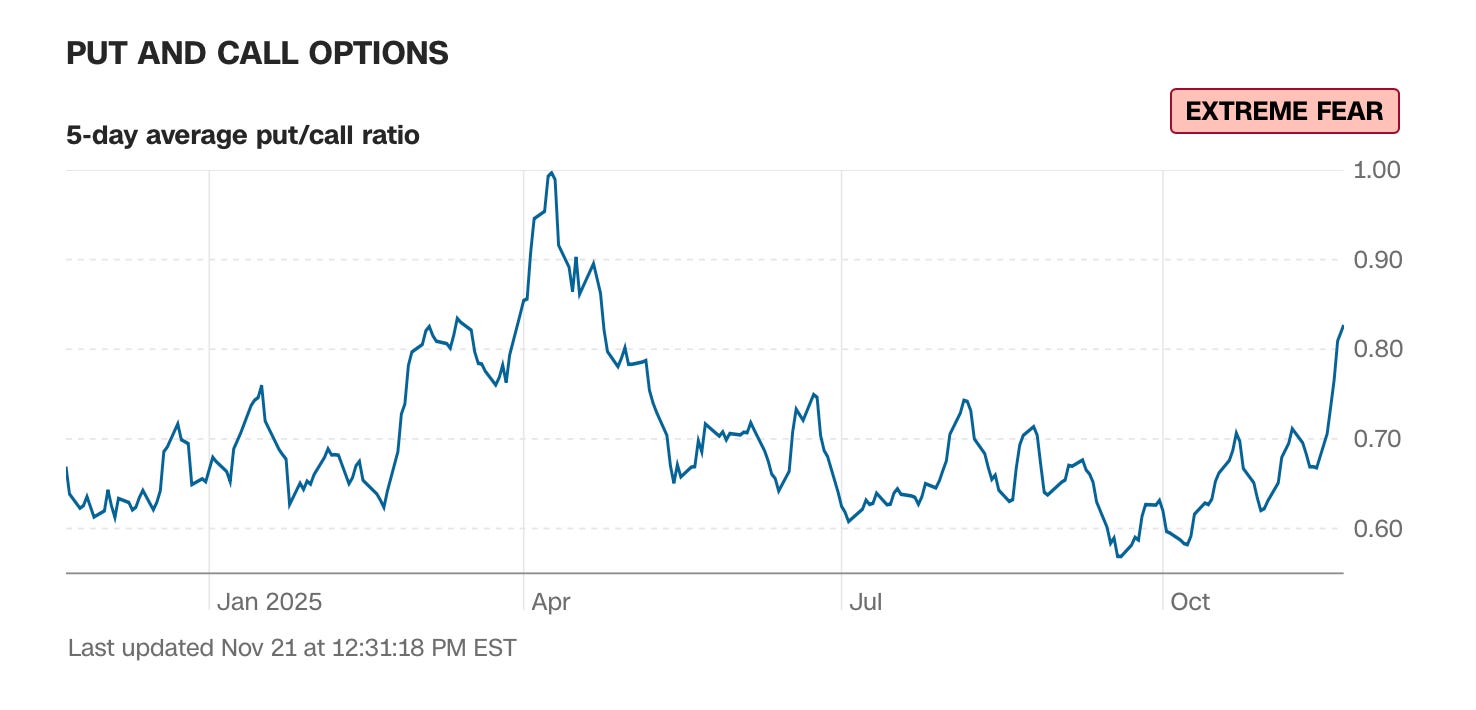
The elevated put/call ratio shows investors buying insurance, expecting more downside.
5. Junk Bond Demand – This tracks the spread between yields on junk bonds and investment-grade bonds. When investors feel greedy, they chase higher yields and the spread narrows. When fear hits, they flee to safety and the spread widens.
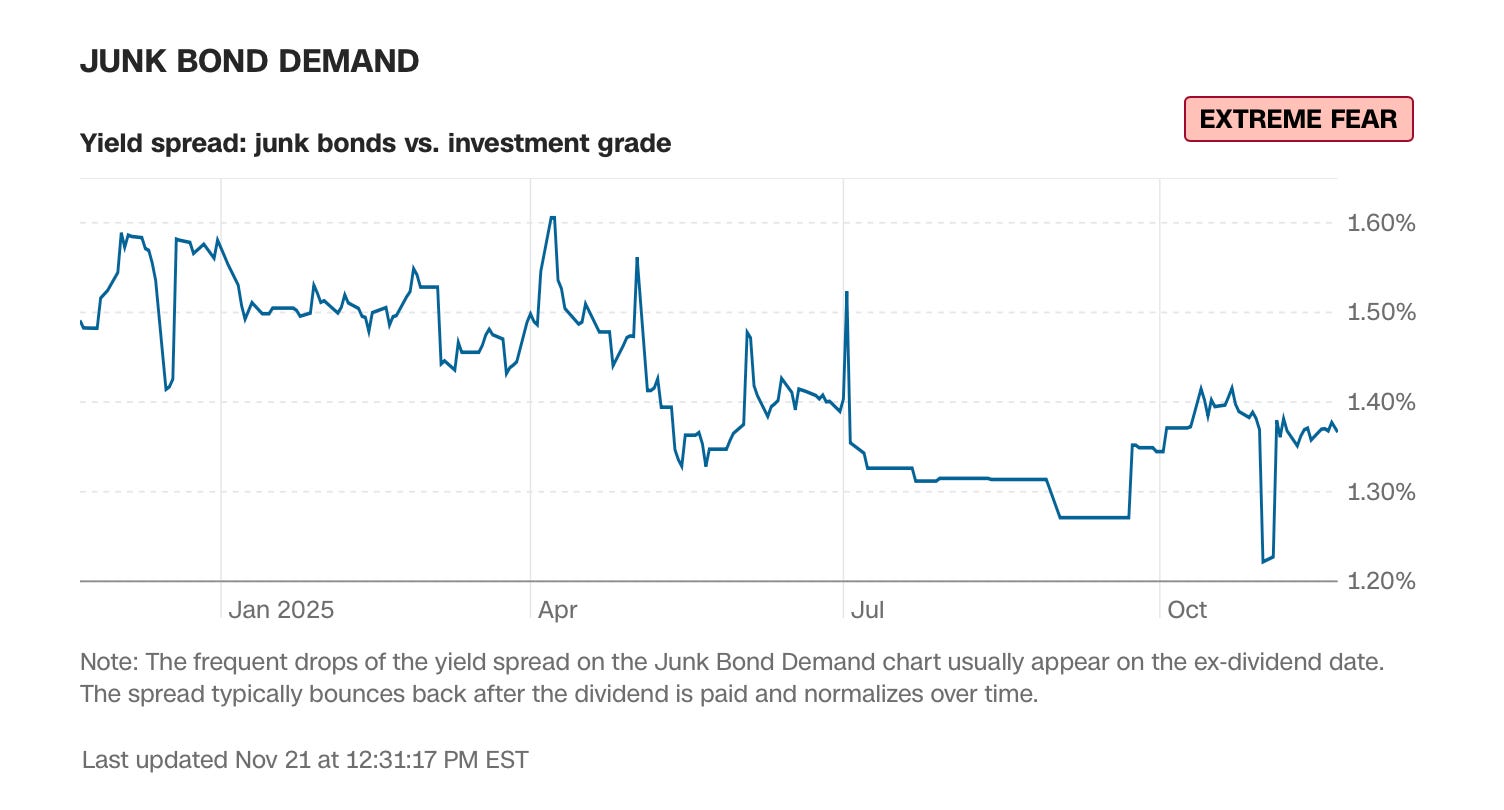
The recent widening tells you the appetite for risk just evaporated.
6. Market Volatility – This component compares the VIX (known as the “fear index”) to its 50-day moving average. Elevated VIX readings signal fear; low VIX signals complacency.
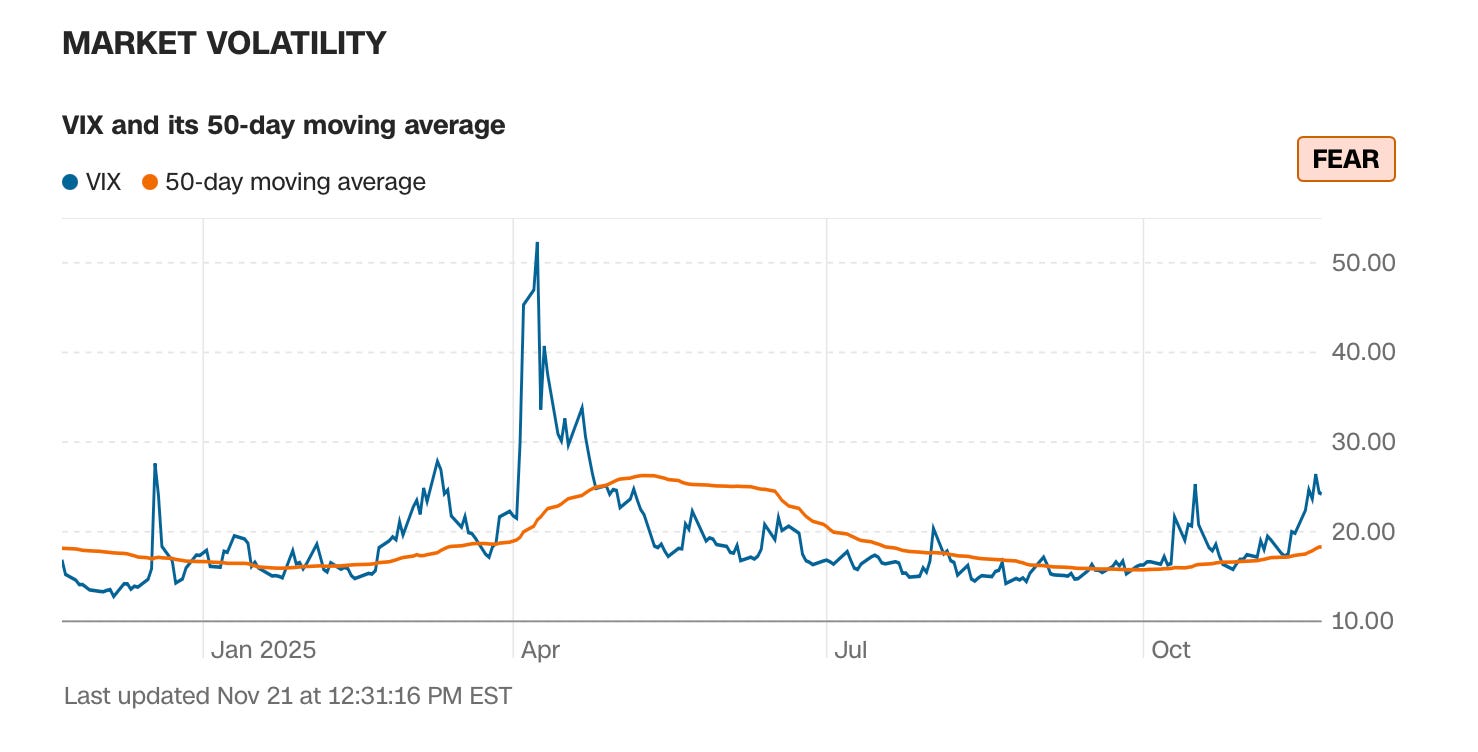
Notice how the VIX spiked in April and again recently? That’s fear manifesting.
7. Safe Haven Demand – This measures the relative performance of stocks versus bonds over a 20-day period. When stocks outperform, investors are feeling greedy. When bonds outperform, they’re fleeing to safety.
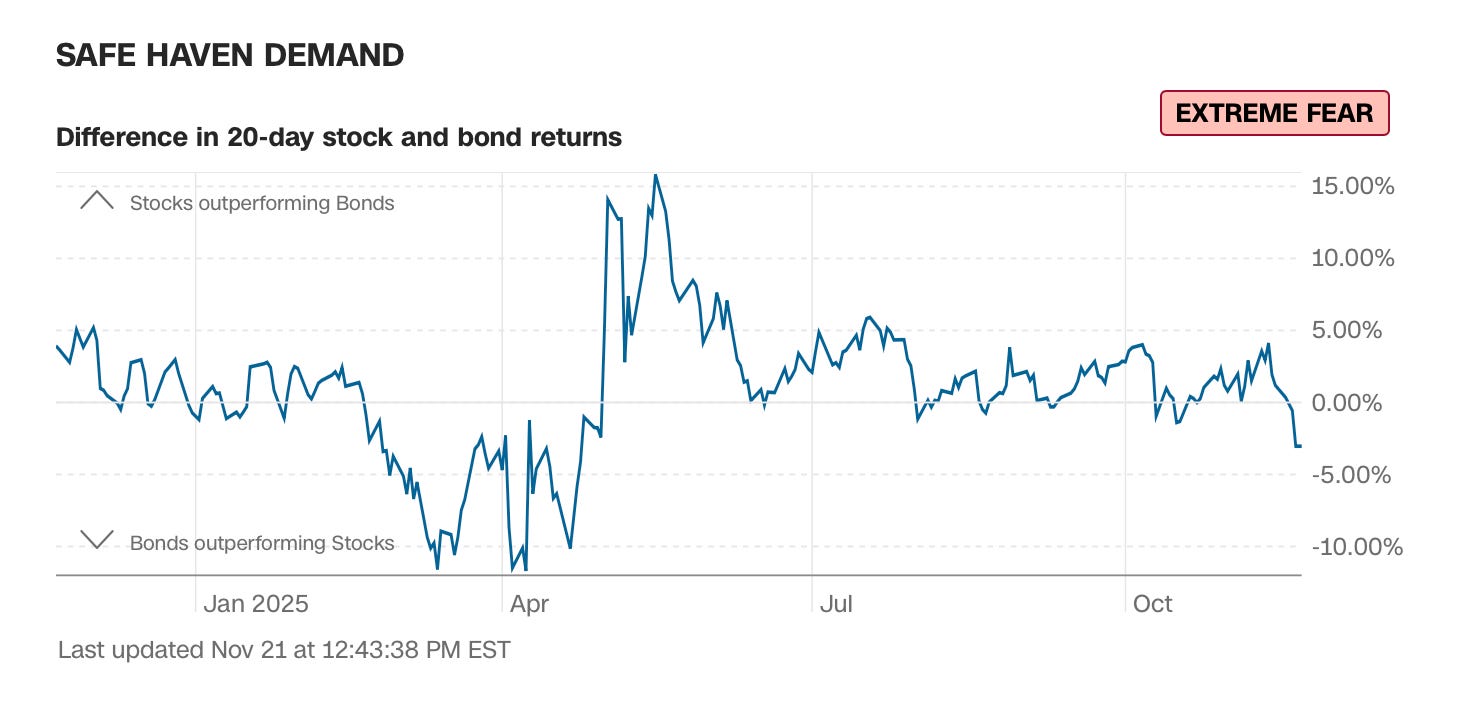
When bonds surge ahead of stocks like this, it’s often a fear signal.
Each of these seven components gets scored individually and then aggregated into that single 0-100 reading. It’s measuring actual investor behavior.
Now, What About Bitcoin?
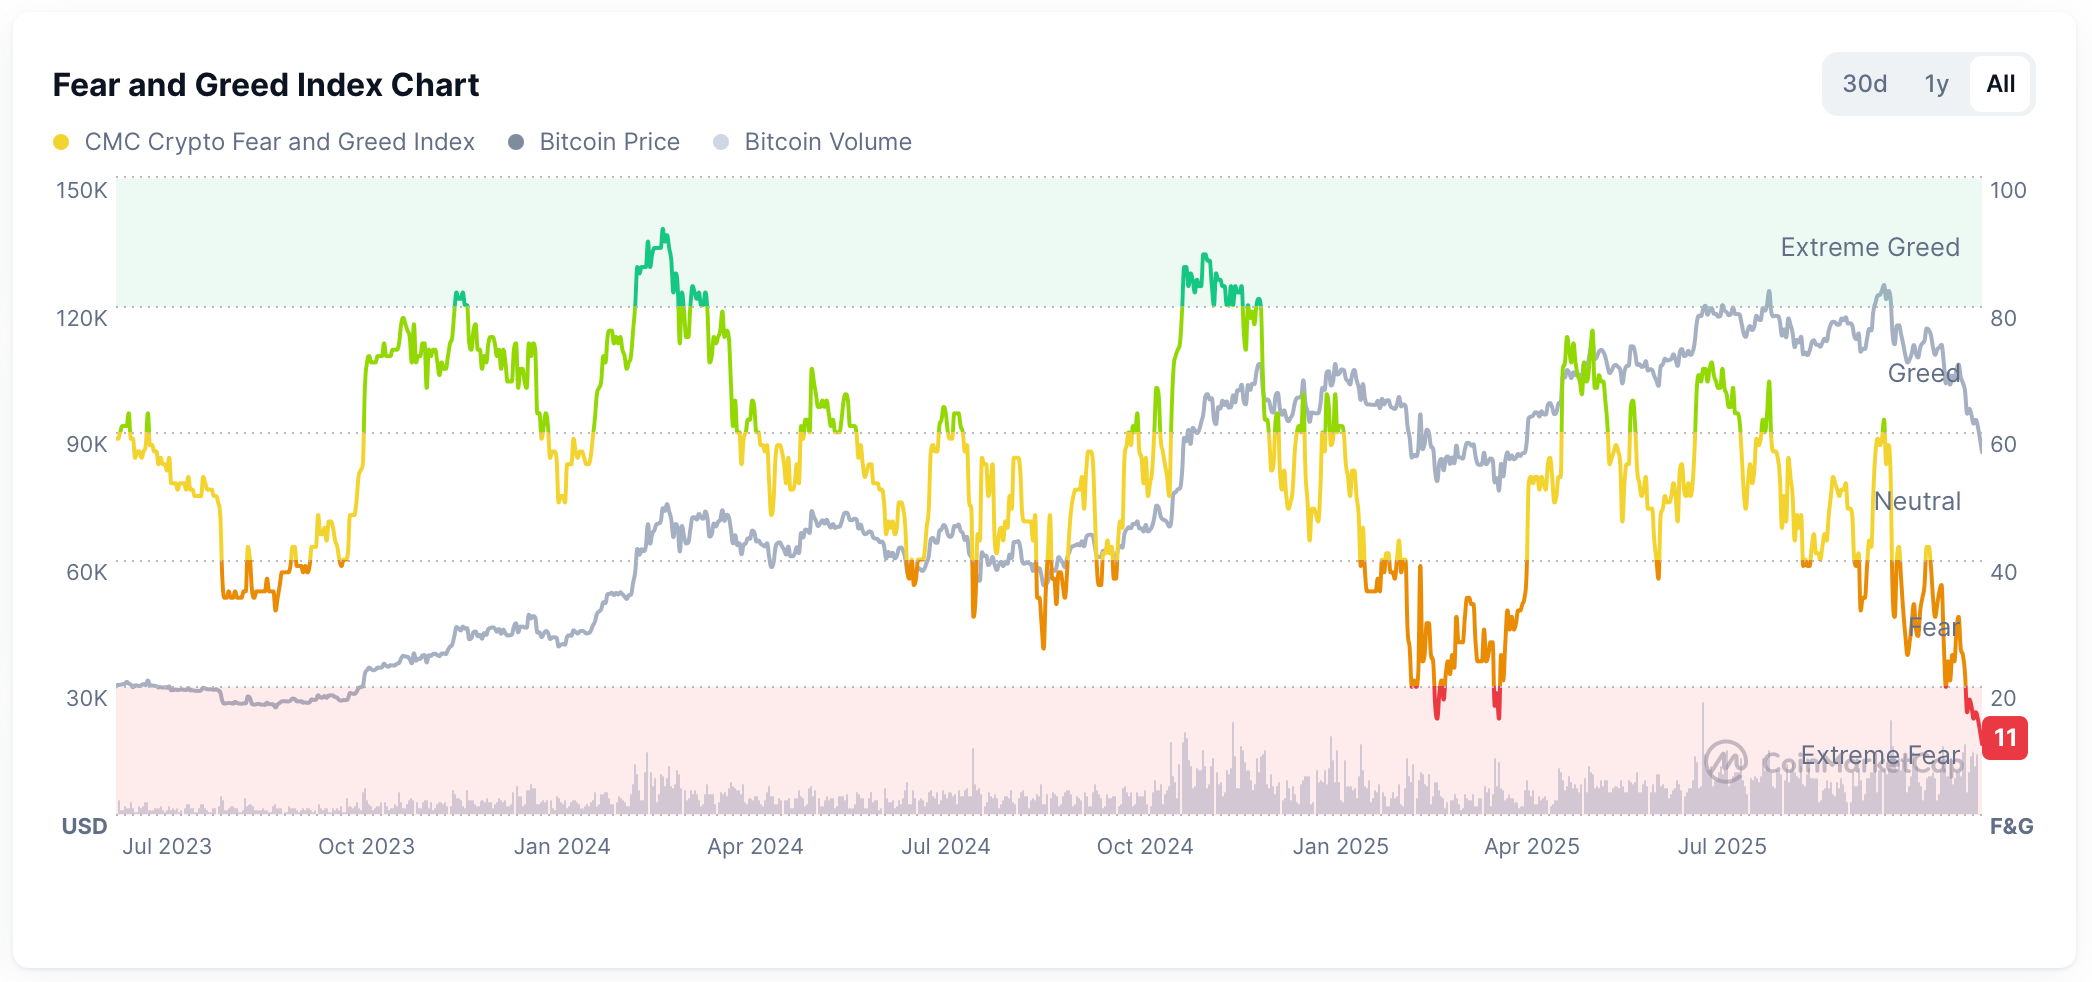
Here’s where things get more interesting. Bitcoin has its own Fear & Greed Index, measured completely differently. And it’s showing even more extreme fear than stocks.
Today, Bitcoin Fear & Greed Index currently reads 11. That’s in contrast to one year ago in November of 2024, when it hit 88 or Extreme Greed.
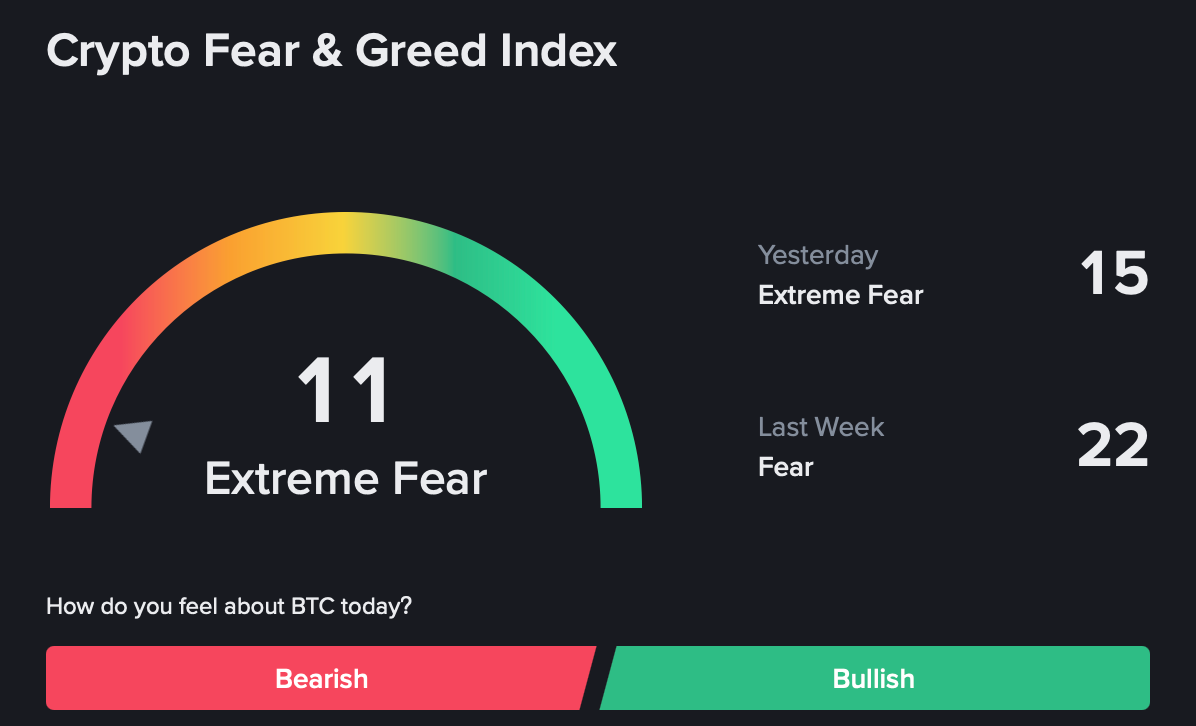
This wasn’t the first swoon to Fear this year, though, as it bottomed at 15 in March.
The Bitcoin F&G Index uses six different components:
1. Volatility (25% weight) – Measures current volatility versus 30 and 90-day averages. High volatility = fear.
2. Market Momentum/Volume (25% weight) – Combines buying volume and momentum versus historical averages.
3. Social Media (15% weight) – Analyzes hashtags, interactions, and engagement rates. High engagement correlates with greed; silence signals fear.
4. Surveys (15% weight) – Weekly crypto polls measuring investor sentiment directly.
5. Bitcoin Dominance (10% weight) – Bitcoin’s market share relative to altcoins. Rising dominance means investors fleeing riskier assets.
6. Trends (10% weight) – Google Trends data for Bitcoin searches. Explosive interest = greed; declining searches = fear.
So we have two completely different asset classes, measured by two completely different methodologies, and both are simultaneously registering extreme fear.
And while stocks rallied Friday on their fear reading, Bitcoin got hammered. After touching $88K overnight, it collapsed to a low of $80K—a 10% intraday swing—while stocks barely moved 2%.
Same extreme fear signal. Completely opposite reactions.
That’s not random. That’s telling us something.
Which brings us to the big questions: Is this fear justified, or is it an overreaction? Is this the classic “blood in the streets” moment to buy? Or is this a falling knife we should avoid catching?
And why are Bitcoin and stocks behaving so differently?
🤔 The Contrarian Case vs. The Falling Knife
There’s a famous quote by Baron Rothschild, the 18th-century British banker who supposedly made a fortune buying during the panic following the Battle of Waterloo, that goes like this,
“The time to buy is when there’s blood in the streets, even if the blood is your own.”
Pretty memorable, it captures the essence of contrarian investing in one brutal sentence.
Warren Buffett put it slightly more politely: “Be fearful when others are greedy, and greedy when others are fearful.”
The logic is simple: markets are driven by emotion. When everyone panics and sells at the same time, prices overshoot to the downside. When everyone gets euphoric and buys together, prices overshoot to the upside. If you can control your emotions and do the opposite of the crowd, you buy low and sell high.
I can tell you from 30 years of investing experience, this is easier said than done.
Also: it works brilliantly...until it doesn’t.
What Happened in April 2025?
