💡The Ticking Yen Time Bomb
Issue 128
✌️ Welcome to the latest issue of The Informationist, the newsletter that makes you smarter in just a few minutes each week.
🙌 The Informationist takes one current event or complicated concept and simplifies it for you in bullet points and easy to understand text.
🫶 If this email was forwarded to you, then you have awesome friends, click below to join!
👉 And you can always check out the archives to read more of The Informationist.
Today’s Bullets:
What is the ‘Carry Trade’?
How Big is the Carry Trade?
What Happened Last Week?
What Next?
Inspirational Tweet:
If you were paying attention to markets this past week, watching the panicky carnage and ensuing enthusiasm and recovery, you likely heard a new term to explain the reason behind the market activity.
A nifty little term that sounds like a sentence with no verbs or a name with no vowels.
The Japanese Yen Carry Trade.
The what?
Exactly. Along with the term have come plenty of either convoluted and confusing explanations or one so simple that it sounds made up:
Borrow yen, buy everything else.
Which actually isn’t really wrong. But it’s also incomplete.
But if this term and these explanations have your head spinning, don’t worry. Because we are going unpack this sneaky and oh so dangerous trade and its implications here today, nice and easy as always.
So, grab your favorite cup of coffee and settle into a nice comfortable seat, as we foray into the world of foreign exchange with The Informationist.
🤓 What is the ‘Carry Trade’?
First things first. We’re going to get geeky here, but not too geeky. I promise.
But to understand the big picture and reasoning behind the current market gyrations, we have to unpack a significant factor in the recent market moves.
The Carry Trade.
Some of you have likely heard me describe and explain this before, but we will review it here one more time.
The essence of a cross-border currency carry trade is when one country’s interest rates (borrowing costs) are lower than another country’s, it produces an inefficiency that can be taken advantage of.
An arbitrage.
Here’s how: Let’s say Country A has low interest rates and Country B has high interest rates.
I can borrow money (Currency A) in Country A and then exchange it for Currency B and invest it at a higher interest rate in Country B.
Read that again until you get it.
This creates what is called Interest Rate Parity, and I wrote all about it a while ago. If you want a deeper dive or a full refresher, you can find that here:
In short, what then happens is that the currency of Country A begins to depreciate versus Country B’s currency and this follows the difference in the yields of each country’s bonds extremely closely.
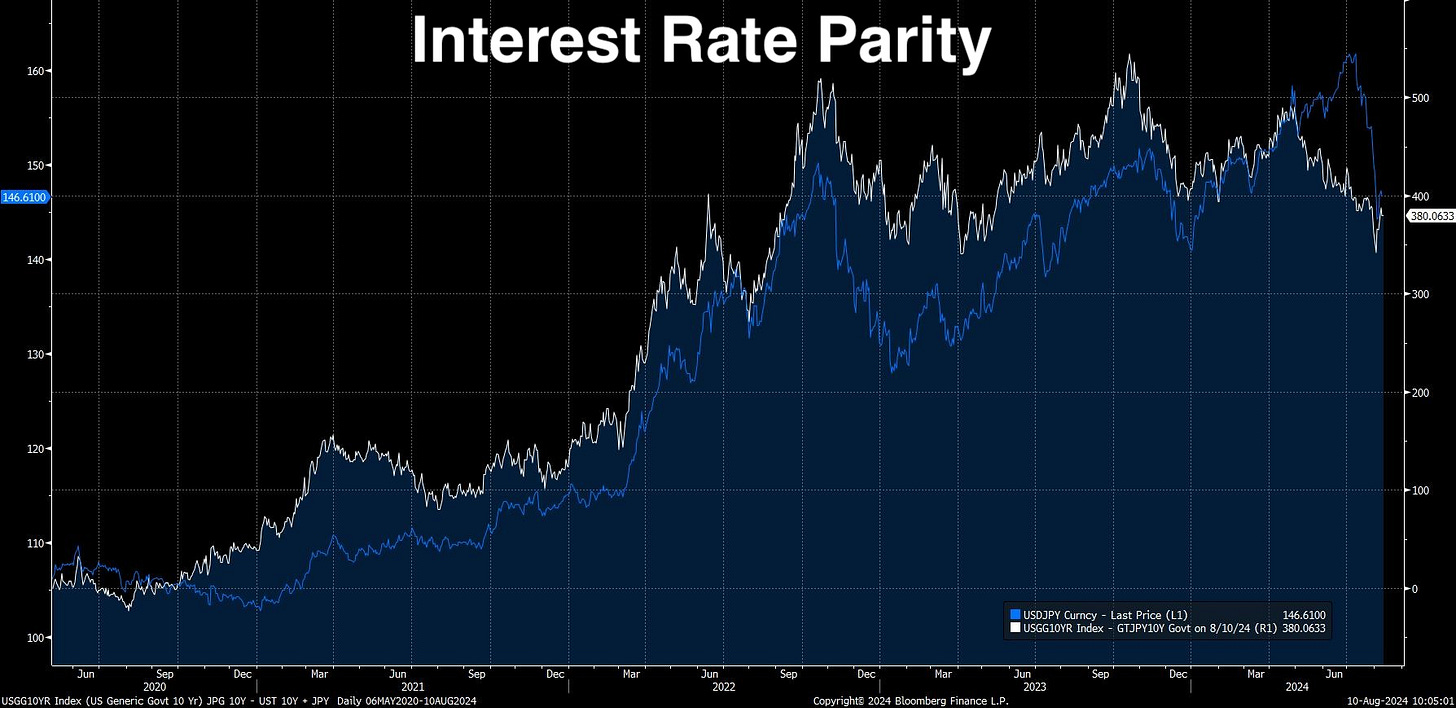
This is exactly what we’ve been witnessing in the Japanese yen versus the US dollar and the Japanese 10yr government bond yield (yielding zero or close to it) versus the US Treasury 10yr Bond yield (yielding up to 5% recently).
So the trade, as of late, was:
sell short 10yr Japanese Government Bonds (i.e., borrow yen) → convert that yen to US dollar (sell yen and buy dollars) → buy US 10yr Treasury (invest in higher interest rate) → collect profit
You can see the relationship in the graph below.
Blue Line = Yen per US dollar
White Line = Spread between US 10yr yield and JGB 10yr yield
Look at how closely the lines follow each other. This is a natural market dynamic from the arbitrage between the currencies and interest rates.
But this is not the only trade they are doing, and it’s not just the US dollar and bonds investors are buying.
See, this is happening all over the world, where there are higher interest rates than in Japan.
Which is pretty much everywhere, as the Bank of Japan has been looking to set a record for extreme monetary manipulation these past few years.
This is not an easy record to win, mind you. Central bankers across the world have become monetary manipulation maniacs. 🤡
In any case.
This trade is also happening with risk assets, where the investor does the trade to buy Treasuries and then uses those as margin to borrow against and buy stocks or other risk assets instead.
And since the US Treasury is considered the premier asset of the world, they can borrow massively against them.
Lever it all up, baby.
Which they clearly did.
And/or they just borrowed cash through yen and straight up bought stocks or other risk assets on the bet that they could pay back the yen before the trades went against them or became unprofitable.
Who is doing the trade?
As far as who is doing all this, they could be investors from anywhere around the world. But primarily Japanese investors seeking to find profits somewhere, anywhere, and US and offshore hedge funds.
These are the leveraged culprits.
The next question is: just how much of this trade is being done?
🤔 How Big is the Carry Trade?
We have seen some wild estimates that put the total global exposure to the yen carry trade in the trillions of dollars.
Quoting Kobeissi’s post above, Deutsche Bank has put the amount at over $20 trillion.
Whoa.
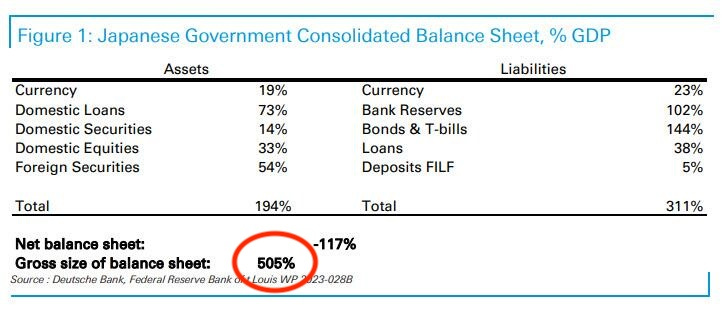
Deutsche Bank analyzed the Bank of Japan’s balance sheet and stated:
"at a gross balance sheet value of around 500% GDP or $20 trillion, the Japanese government's balance sheet is, simply put, one giant carry trade."
Because Japan's GDP is approximately $4.2 trillion, this gives us the $20 trillion that Deutsche Bank is estimating.
$4.2T x 5.05 = $21.2T
But this assumes that the entire BoJ balance sheet is essentially one giant carry trade.
I personally think this is blown way out of proportion and the actual market impacting carry trade is a mere fraction of this.
My friend Lyn Alden (@LynAldenContact) pointed me to this chart that shows the cross border yen borrowing.
When we convert this to USD, it totals closer to $1.7 trillion. Add 2 to 3X leverage and we get to $3 to 5 trillion in total for the yen carry trade.
Still. What is scary about that is the amount of market turbulence that was seemingly triggered by this trade, even if it was far smaller than Deutsche’s $20T estimate.
On that. What exactly did happen, anyway?
😱 What Happened Last Week?
To start off, the Nasdaq 100 Index (the embodiment of risk assets) peaked in early July, and has been gravitating lower ever since.
In other words, investors had already begun rotating out of risk assets, selling them for cash (short term Treasuries and T-Bills) and other less volatile assets like gold.
Remember, the US stock market is the largest market for risk assets in the world.
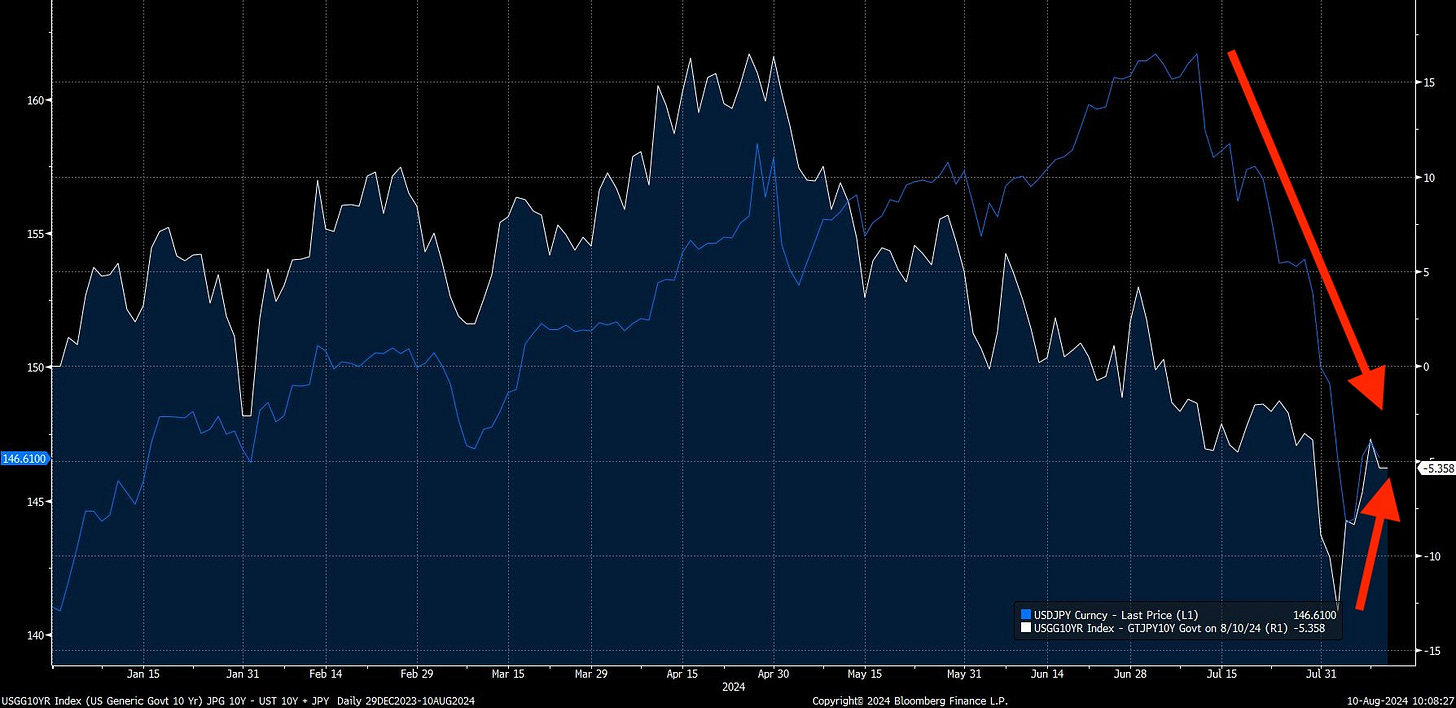
During this time, the normal parity of yen to Treasury spread (remember the chart up above?) had begun to widen. This is because the yen was basically in free fall.
Like so:
I’ve talked about this recently on various podcasts, pointing out that the BoJ would have to do something to intervene, by either buying yen (they would do this by selling some of the $1T+ US Treasuries the own and in turn selling USDs) or borrowing USDs on swap from the Fed and buying yen with those.
They were in essence playing a game of chicken with the Fed, hoping the Fed would soon lower rates and the yen would then stabilize against the dollar.
Any way you cut it, this divergence would have to close soon.
And that it did.
To start it all off, the BoJ raised rates for the first time since 2007. From .1% to .25%.
See that tiny little hike? Seems innocuous, doesn’t it? No big deal, right?
But then yen’s response was to immediately strengthen.
And Japanese markets sold off in response, with the Nikkei 225 Index down over 7% in two days, following the yen move closely.
Then, the US released unemployment data that put investors on edge, wondering if the US had just slipped into recession, leading them to sell US equities.
Leading them to unwind some of this carry trade and only making the yen stronger and pushing other carry traders to have to unwind some of their positions.
Then on Monday morning, August 5th, after a whole weekend of contemplation and Bitcoin selling off in anticipation, the markets in Japan crash, down 12%. The yen rockets higher, the carry trade unwinding.
The US markets follow, with the Nasdaq crashing 6% in minutes.
A flight to safety ensues, pushing US 10yr yields lower, only exacerbating the situation, making the carry trade less attractive and triggering unwinds and likely margin calls.
The alligator jaws of the yen vs interest rate spread closes fast.
And it all becomes a giant feedback loop.
Yen strengthens (primarily driven by yen bought into strength on short covering), risk assets are sold around the globe, investors use proceeds to buy US Treasuries and those yields fall, the fall in yields weakens the US dollar, the yen strengthens, and the cycle repeats.
And it was not exactly because of the .15% hike in BoJ benchmark rates.
In truth, it was because of relentless market manipulation by the BoJ which allowed the world to borrow money for free for over a decade.
And that era was just declared over by the BoJ, triggering a near panic for investors and hedge funds who have been playing the free money for risk assets game on leverage all this time.
And the markets crashed in response.
But the markets have since recovered, so is it over now?
🫣 What Next?
JP Morgan has declared that carry trade is 50% closed out, and the Chief Strategist of LPL Financial estimates that the trades is 75% finished.
That said, Bloomberg notes that when we had a similar move in the yen with a carry trade, after the 1998 Long Term Capital Management meltdown and 2007 Great Financial Crisis, it took 100 to 200 trading days to normalize again.
But after the Nikkei and US markets crashed, we had a remarkable response from the BoJ who declared: “[T]he bank will not raise its policy interest rate when financial and capital markets are unstable.”
And there you have it. A single 15bps move caused a cascade of risk asset selling that piled up to $6.4 trillion of losses and the BoJ immediately did an about face.
This, my friends, is evidence of just how leveraged global markets are today, and how hesitant central bankers are to upset the balance.
Nobody wants to tip the markets into a meltdown and cause a global economic crisis.
And so, I would not expect a move in rates by the BoJ for a while now.
But that does not mean this chapter is closed and the issue is resolved.
There’s likely still trillions of leveraged dollars piled into the carry trade, and, as the saying goes, it may take a while for that goat to make its way through the boa.
And if the US markets tip into hard recession before the Fed acts?
We may see round two of the Carry Trade meltdown.
That’s it. I hope you feel a little bit smarter knowing about the Carry Trade, how it works, and its implications.
If you enjoyed this free version of The Informationist and found it helpful, please share it with someone who you think will love it, too!
Talk soon,
James✌️


As always.. well explained and incredibly useful. Thanks.
Doesn’t the Yen carry treads also put the US Fed in a precarious position? If the US lowers rates, then this also makes the YCT less attractive, correct?