
💡Is The Yen About To Hyperinflate?
Issue 123

✌️ Welcome to the latest issue of The Informationist, the newsletter that makes you smarter in just a few minutes each week.
🙌 The Informationist takes one current event or complicated concept and simplifies it for you in bullet points and easy to understand text.
🫶 If this email was forwarded to you, then you have awesome friends, click below to join!
👉 And you can always check out the archives to read more of The Informationist.
Today’s Bullets:
Yen on the Move
Interest Rate Parity
BoJ Intervention(s)
The End?
Inspirational Tweet:

If you have been paying attention to financial news recently, you may have seen an article or two focused on the recent ‘collapse’ of the Japanese Yen. You may have noticed that bond yields and other currencies are also quoted in these articles, attempting to explain the situation.
But what does it all mean, how and why is it happening, and the most important question, perhaps, is the Yen about to collapse and hyperinflate?
If these questions have you wondering what it all means and why it matters to you, have no fear.
Because we’re going to unpack it all for you, nice and easy as always, today.
So, pour your favorite cup of coffee and settle into a comfortable seat for a currency-focused morning with The Informationist.
🫣 Yen on the Move
First things first, what are we talking about here, and what exactly are the measures we are using? If you’re not a currency expert, sometimes the FX (foreign exchange) quotes can be confusing.
In essence, exchange rates are quoted in two ways: direct and indirect. The choice of which one to use often depends on historical convention.
For instance, the British pound (GBP) was traditionally quoted in terms of the amount of GBP per unit of foreign currency, reflecting its historical dominance in global trade.
That said, because the USD is the world's primary reserve currency and is widely used in international trade and finance, most other exchange rates are quoted in terms of the USD.
Examples include the Canadian dollar, Swiss franc, and yen.
This is why we see articles quote 150 or 160 for the yen price, not .006 or .007.
OK. Now that we have that cleared up. How poorly has the yen been trading? How much has it lost in value versus the USD and other currencies?
You’ve likely seen a chart like this recently:

Showing the yen ‘collapsing’ against major currencies like the euro, the British pound, the Swiss franc, and the US dollar.
To visualize more easily, here’s the yen % performance versus those major currencies:

And so, in the last five years, the yen looks like it has absolutely collapsed versus all other currencies, as if it is all but in free fall.
But let’s take a step back for a moment. Let’s zoom out.
Looking at the yen performance vs. the US dollar over 50 years, we see this:
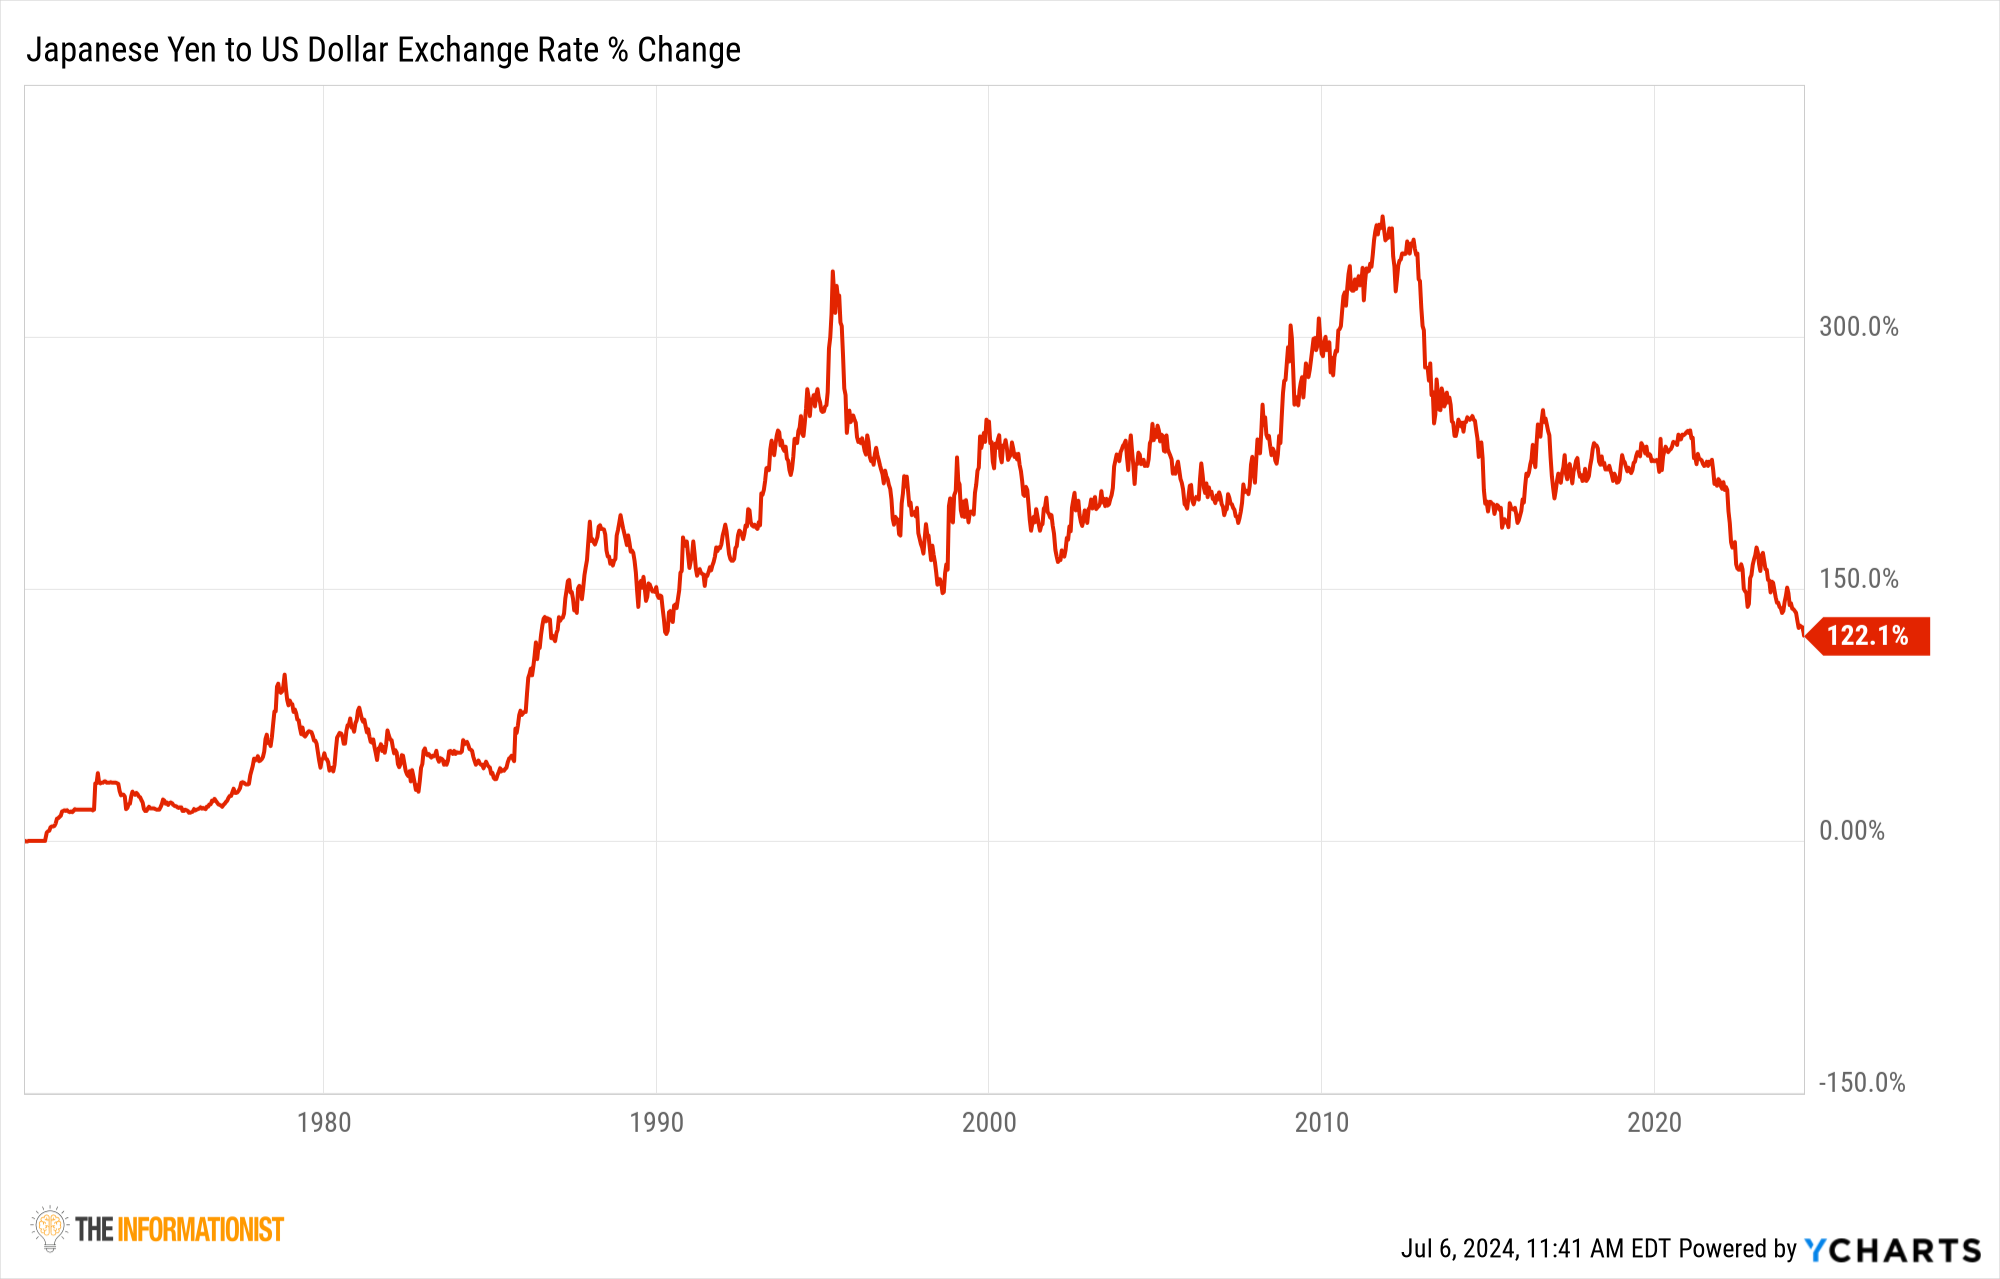
You read that right, the yen has actually appreciated 122% versus the US dollar in the last 50 years.
Much of this can be attributed to the post-war expansion in Japan that led the economy to be a huge net exporter, which created demand for yen, driving the exchange rate higher.
That, plus the Plaza Accord in 1985 helped drive the US dollar to depreciate versus other major currencies, including the yen.
If you are wondering what the Plaza Accord was, I wrote all about that in a newsletter that you can find here:

For the TL;DR crowd: The Plaza Accord was an agreement among major economies to intervene (read: manipulate) the currency markets to depreciate the US dollar. Why? To reset trade imbalances for the US.
In any case, here we are now. And while the yen depreciation looks bad, it is not yet at all-time low levels.
The momentum, however, is undeniable. The yen is progressively weakening, and at a rapid pace. But why?
The answer has to do with something called ‘interest rate parity’.
