
💡 Is the BLS Corrupt or Just Incompetent?
Issue 177

✌️ Welcome to the latest issue of The Informationist, the newsletter that makes you smarter in just a few minutes each week.
🙌 The Informationist takes one current event or complicated concept and simplifies it for you in bullet points and easy to understand text.
🫶 If this email was forwarded to you, then you have awesome friends, click below to join!
👉 And you can always check out the archives to read more of The Informationist.
Today’s Bullets:
How the Payroll Report Actually Works
The Big Picture
Dissecting the Revisions
Fed Policy Implications (and What to Do About It)
Inspirational Tweet:

Ah, yes. The BLS Employment Situation Summary (aka jobs report) came out on Friday, and it was a doozie, judge.
Not the most recent data and survey, mind you, but rather the revisions of previous surveys.
And the markets reacted accordingly.
But how did they react and why?
Well, here is where it gets dicey, and we will have to do a bit of an autopsy on the BLS body, so to speak.
But have no fear, we will do it all nice and easy, as always, for you here today.
So, grab a big cup of coffee, and settle into your favorite seat for a trip into Federal Bureau-Land with this Sunday’s Informationist.
🤓 How the Payroll Report Actually Works
Before we can truly understand the jobs report, we need to understand how it’s built—and where it breaks down.
A brief history.
First, the Bureau of Labor Statistics (BLS) was established in 1884 under the Department of the Interior and moved under the Department of Labor in 1913. It’s main job is to measure employment, productivity, price, and compensation data.
Its reports are highly anticipated by markets, businesses, and of course, the Federal Reserve who use them to make decisions.
The monthly Employment Situation—what we all call the “jobs report”—has been released on the first Friday of every month since 1950.
It includes two surveys:
The Establishment Survey (aka Current Employment Statistics), which gives us payrolls, wages, and hours worked.
The Household Survey (aka Current Population Survey), which provides the unemployment rate, labor force participation, and related figures.
These are two totally different datasets. And for today, we’re focusing on the Establishment Survey, because that’s where the big revision happened this week.
How does the BLS conduct its surveys?
Well, each month, BLS surveys about 122,000 businesses and government agencies, covering over 666,000 workplaces. From this, they create the non-farm payroll number that we see in the headlines.
Here’s the process:
Initial Collection (Week 1–3 of the month):
BLS contacts survey participants via phone, fax (yes really), email, or using a secure online form
Only about 60% of the sample responds by the deadline for the first Friday release
The first estimate is built on incomplete data (i.e., it’s built on 🐶💩)
First Revision (Next Month):
New responses trickle in
BLS updates the number with more complete information and refines them with seasonal adjustments
Second Revision (Two Months Later):
Final updates for that month using nearly full sample (~90–95%)
This version is considered the most accurate estimate BLS will publish for that month—until...
Annual Benchmark (Each February):
BLS reconciles monthly estimates to Employment and Wages data based on actual tax filings from employers
This is the true accuracy check, but it comes with a lag of 8–12 months (🤯)
So, when you see the payroll numbers, realize that:
They’re based on only part of the full dataset
They’re adjusted using models that are constantly being recalculated
And they’re not even final—not even close
Now you may be asking, besides pure accuracy, why would the data change so much?
There are three big reasons:
Low Initial Response Rate
A consistent drop in initial response rates since the pandemic and so, data is coming in later with even larger revisions
Employers are busy running businesses, they don’t have time to answer random govie-sponsored surveys
Concurrent Seasonal Adjustment
BLS re-estimates seasonal patterns every month, and as new months come in, earlier seasonal adjustments change—even if raw numbers don’t
Sector-Specific Timing Noise
School employment in June, Holiday retail in November, Construction in a sloppy winter, can all cause timing mismatches, where jobs happen earlier or later than models predicted
The result? Big swings are often timing distortions, not real changes in underlying demand.
By now you may be asking, OK, so is it all useless, this BLS data?
Not useless, but rather very limited and must come with a huge caveat.
The reality is that the BLS payroll report is little more than a lagging, smoothed, model-driven estimate of the strength of the labor market.
What is it useful for, then?
Trend analysis
Significant sector breakdowns (i.e., healthcare vs. manufacturing vs. government, etc.)
Confirmation of major changes (not detection of them)
What it’s not good for is catching sharp downturns in real time.
Case and point is this week’s report.
🫣 The Big Picture
How bad were the revisions?
So bad that the market freaked out, rate cut probabilities soared, and The President fired the Commissioner of BLS.
The July jobs report didn’t just deliver a weak headline—Nonfarm Payrolls came in at just +73,000 jobs—missing expectations by a mile.
The Unemployment Rate ticked up to 4.2%, its highest level in more than two years, and wage growth slowed to +0.3% month-over-month, or 3.9% year-over-year.
But the real story was the revisions.
BLS revised its prior two reports—May and June—downward by a combined 258,000 jobs, the largest two-month negative revision since the first months of the pandemic in 2020.
Like so:
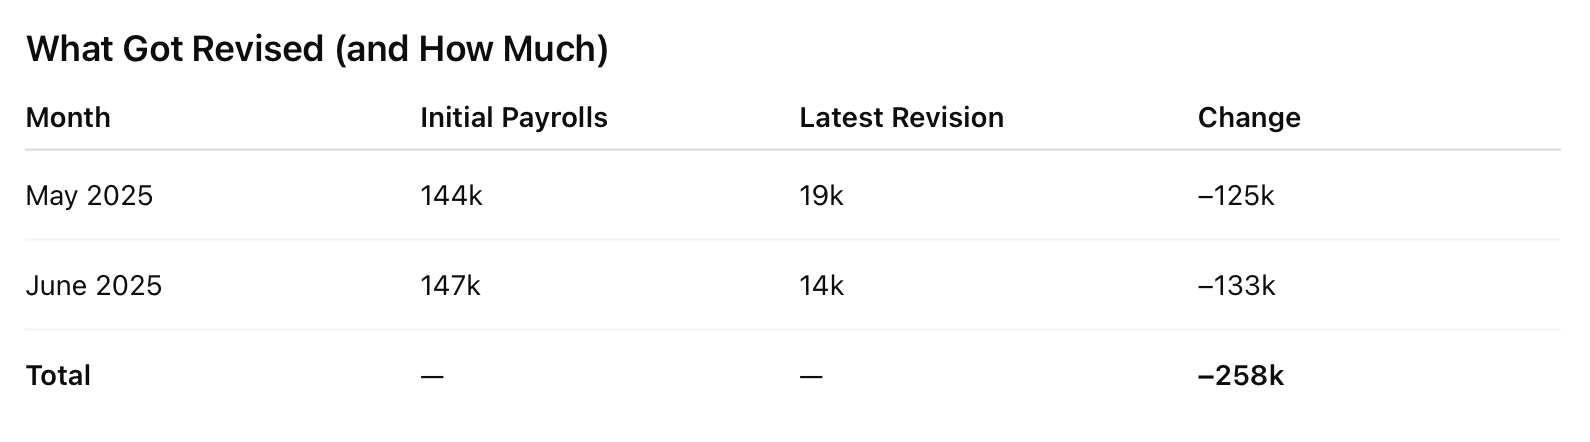
Oh my.
Problem is, revisions like this cannot be merely chalked up to statistical noise. When the BLS revises prior months down this significantly, it’s raising red flags that suggest the labor market wasn’t as strong as originally thought—and that the trend is deteriorating.
The three-month moving average of job gains has now dropped to under 70,000, the slowest pace since early 2021.
No surprise, markets reacted immediately. Treasury yields fell sharply across the curve, with the 2-year yield dropping 28 basis points. Equities dropped, with the S&P 500 and NASD down 1.6% and 2%.
And most importantly, Fed Funds futures markets repriced the probability of a September rate cut.
We will focus on that in a bit. But for now, let’s stay focused on the BLS.
Bottom line, this wasn’t just a weak print. It was a shift in narrative—away from resilience and toward softening.
Looking at the revisions since the beginning of 2025, it’s even worse:
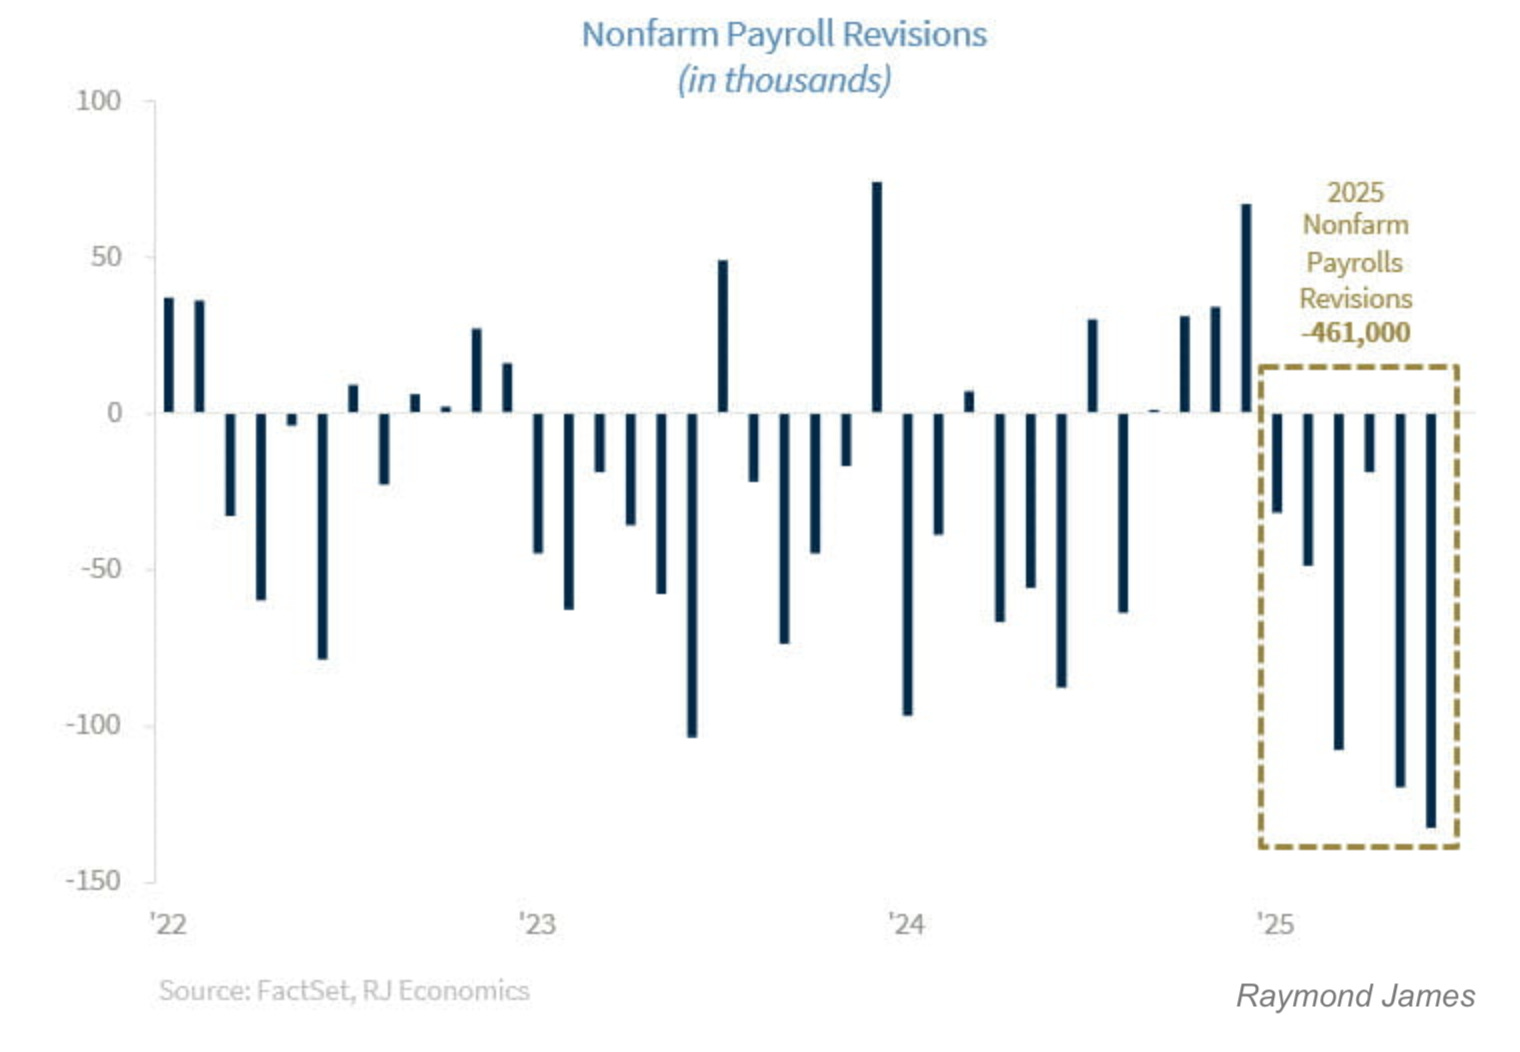
Collectively, all these revisions and apparent growing softness in the labor market will soon force the Fed to re-assess its current rate policy.
At least that’s the knee-jerk reaction from analysts and traders alike.
But there remains many questions as to just why the revisions have been so large this year.
To do so, let’s address Anna Wong’s Inspirational Tweet for some answers.
🧐 Dissecting the Revisions
Let’s be real for a moment. This was a massive revision—especially for a labor market that was thought to be holding strong and steady.
Naturally, the first question was: how could the BLS miss that many jobs, two months in a row?
Bloomberg Chief U.S. Economist Anna Wong broke it down. Her key insight? The revision wasn’t due to a single mistake—but rather a combination of factors the BLS deals with every month.
This time, though, they all pulled in the same direction.
To understand better, let’s walk through what didn’t cause the revision—and what did.
