
💡 Can We Trust GDPNow?
Issue 161
✌️ Welcome to the latest issue of The Informationist, the newsletter that makes you smarter in just a few minutes each week.
🙌 The Informationist takes one current event or complicated concept and simplifies it for you in bullet points and easy to understand text.
🫶 If this email was forwarded to you, then you have awesome friends, click below to join!
👉 And you can always check out the archives to read more of The Informationist.
Today’s Bullets:
GDPNow: The Model Sounding the Alarm
From Boom to Contraction
“Liberation Day”
What about Bitcoin?
Inspirational Tweet:

If you have been an investor or just following macro economics, you’ve likely seen the chart above, you know with the strange shaded areas and squiggly lines that never seem to match up.
But what exactly is the GDPNow model, what is the latest reading telling us, and because it is coming straight from the Fed, is it something we can trust?
All good questions and ones we will answer, nice and easy as always, here today.
So, pour yourself a big cup of coffee and settle into your favorite chair for a little GDP-talk with this Sunday’s Informationist.
🚨 GDPNow: The Model Sounding the Alarm
GDPNow. What a funny little chart, eh?
Launched in 2014, The Atlanta Fed’s GDPNow model was designed to provide transparent, high-frequency estimates of US economic activity.
Unique for Federal Reserve type of output, GDPNow is updated multiple times a month.
And so, as investors scan headlines and economic data for hints of the health of the US economy, the Fed’s GDPNow model is one of the most followed indicators.
But unlike Wall Street forecasts filled with subjective assumptions and narrative bias, GDPNow is (supposedly) purely data-driven.
How?
The GDPNow model ingests key economic releases—like retail sales, ISM reports, and trade balances—and runs them through the same framework the Bureau of Economic Analysis (BEA) uses to calculate GDP.
The result? A real-time “nowcast” of the current quarter’s GDP growth—with no “opinions” attached.
Did you catch that?
The GDPNow model estimates quarterly real GDP growth, not the full-year figure.
When it shows -2.8%, that means the economy is tracking at a -2.8% annualized pace for Q1, based on current-quarter data only.
It does not project full-year 2025 growth, nor does it account for future policy changes or momentum shifts in later quarters. Each quarter is modeled independently, and full-year GDP is calculated only after the fact by summing actual quarterly results.
In other words, GDPNow is designed to tell us what’s happening now, not where we’ll end up in December.
And lately, it has not-so-quietly been flashing red.
You can see here, the light green line is GDPNow model and the date of each recent forecast.
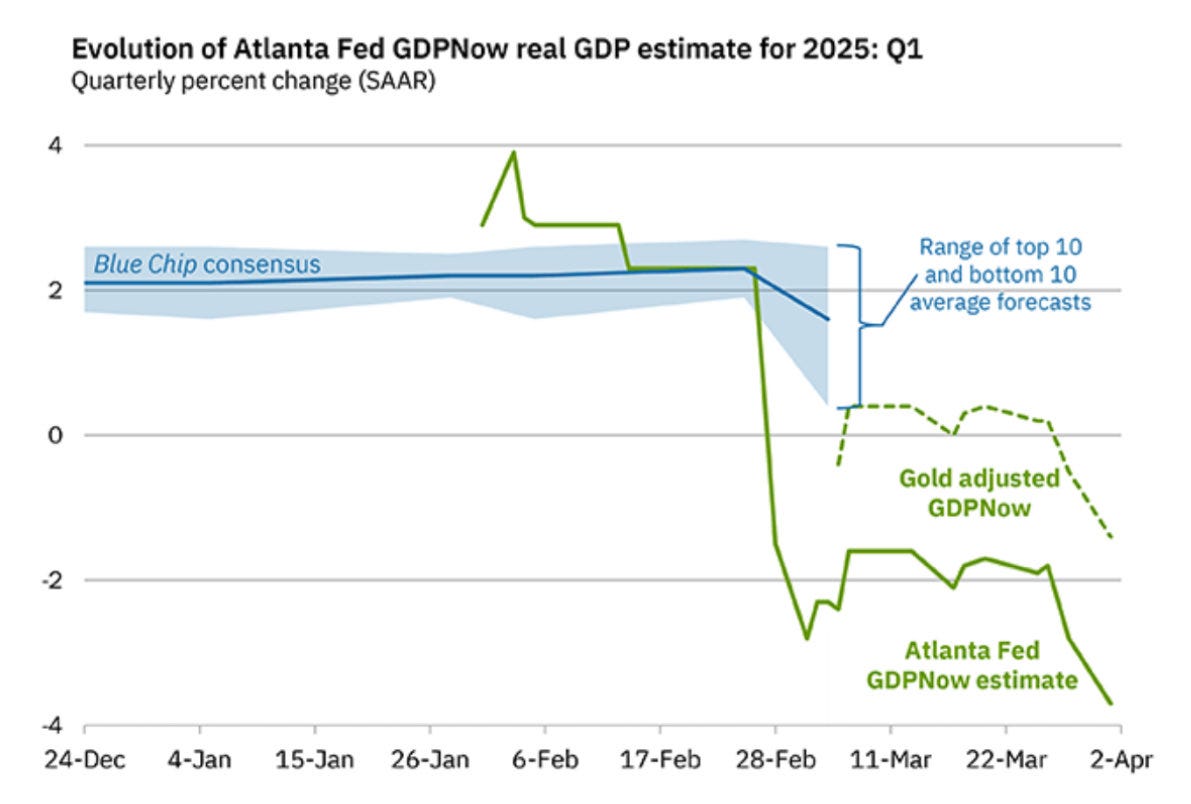
But what is that blue shaded area?
This is the Blue Chip consensus, and it refers to forecasts from economists at major banks, investment firms, and research houses. The shading, essentially shows the range of forecasts.
And even though it is updated monthly, these forecasts adjust slowly and have a narrative bias, which is why GDPNow often strongly leads during inflection points.
Like right now.
But how accurate is the GDPNow forecast?
To gauge, I found a great chart by Michael Lebowitz in an Investing.com article, that compared the accuracy of both the Atlanta and the St.Louis Fed Nowcast models (yes St. Louis and NY have them too, because, why not?).
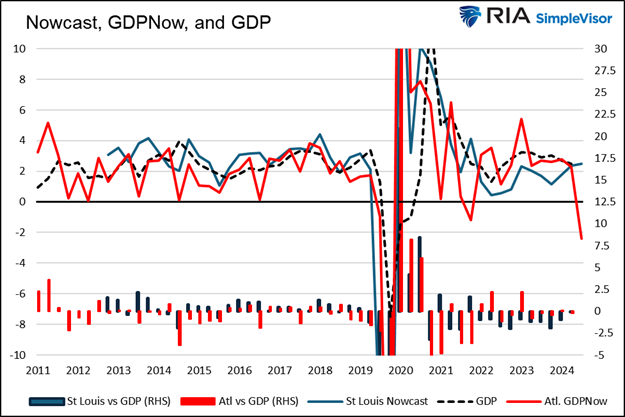
OK, what are we looking at?
On the left side scale:
🔵 Solid blue line: St. Louis Nowcast (actual forecast)
🔴 Solid red line: Atlanta GDPNow (actual forecast)
⚫ Dashed black line: Actual GDP (as reported by the BEA)
But look at the bars at the bottom of the chart.
These show the difference (error) between the forecasts and actual GDP (right side scale).
So. Lot’s of error and inaccuracy, it seems.
But, close enough for government work, as we like to say.
Even so, what is the latest GDPNow forecast telling us?
🤨 From Boom to Contraction
Just this past Thursday, we got a new GDPNow forecast from Atlanta.
So what does it say, er, Now?
